

Interstate Bridge team identifies nearly $50 billion in federal discretionary funds to compete for bridge
The Interstate Bridge Replacement Program (IBR) team is trying to satisfy requests from multiple interests resulting in a likely delay in producing a final “solution” until July according to IBR Administrator Greg Johnson.
“We have asked our partners what their ‘must have’ items are, in order to get to a ‘yes’ on this program,” Johnson said.
Modeling data from Metro and the Southwest Washington Regional Transportation Commission (RTC) will be done to provide those answers this spring. But Johnson emphasized they cannot go beyond July in the delay.
Following the recent passage of the $1.2 trillion Infrastructure Investment and Jobs Act (IIJA), Johnson and his Interstate Bridge Replacement Program (IBRP) team have identified $48.8 billion of discretionary federal funds they believe they can compete for to help pay for the various components of the replacement bridge. Not mentioned was the fact that these competitive grant funds are in addition to an estimated $5.36 billion for Oregon and $8.6 billion for Washington will receive from the IIJA.
Johnson briefed the Executive Steering Group (ESG) last week and the 16 members of the Bi-State Bridge Committee of legislators.on Tuesday. “Our team has been doing a deep dive into the infrastructure bill and where we may find ourselves being eligible for funding,” he said.
It appeared the ESG was seeking to slow down the project, mentioning many concerns, needs and competing political interests they represent. The bi-state committee of legislators was more concerned about the delays causing more problems and the potential for losing federal funding opportunities.
Johnson shared his team has been asked to provide more data on what might change travel demand on the I-5 corridor. How might higher toll rates in Oregon’s congestion pricing scheme impact travel demand and what is the highest possible throughput on transit and its potential impact on I-5 traffic.
His team will look at “opening day traffic in 2032” and seek to project what that traffic would look like under numerous scenarios and alternatives. He believes his team can deliver that information by April.
Both committees provide oversight and direction, and have asked for more details on numerous areas of the project. They were briefed on the discretionary funding coming from three separate sources created by the IJAA. They also received information on tolling, population changes since 2010, and an introduction to the traffic data.
With only two bridges across the Columbia River, the over 70,000 daily Clark County commuters are seeking traffic congestion relief and time savings as they go to and from work. Overall average weekday daily traffic (AWDT) increased 12 percent between 2005 and 2019, with 280,000 trips in 2005 and 313,000 in 2019. Traffic grew on both bridges, but the I-205 Glenn Jackson Bridge traffic grew at over three times the rate of I-5 because it had larger capacity.
Clark County saw the largest population gain in the four-county area, with 18 percent growth since 2010. It also had the largest gain in black, indigenous, people of color (BIPOC) category, adding 59,000 people, which was a 76 percent increase. Clackamas County had the second largest increase of 65 percent. It was noted in the equity briefing that the historic north and northeast Portland minority community had declined as people moved to more affordable locations in the suburbs, including Vancouver, Clark County, and east Multnomah County.
IIJA Discretionary dollars
Johnson’s team noted there were three main sources of discretionary federal grant money they would be competing for with the other states. A new Competitive Bridge Investment Program has $15.8 billion, $9.2 billion guaranteed and $6.5 billion to be funded by future appropriations. It could cover up to 50 percent of a project’s cost for replacement, rehabilitation, preservation, or protection of bridges.
A new National Infrastructure Project Assistance Program could cover up to 60 percent of project costs. Highways and bridges, freight, intercity rail, public transportation, and multimodal projects would be eligible. Half of the $10 billion is reserved for projects costing $500 million or more.
The Federal Transit Administration (FTA) Capital Investment Grant New Starts Program has the largest share of the discretionary funds, $23 billion for transit projects. There is $8 billion guaranteed and $15 billion is subject to future appropriations. This is for “fixed guideway transit” such as rail and bus rapid transit.
Vancouver Mayor Anne McEnerny-Ogle shared that she and Portland’s Jo Ann Hardesty made the motion at the Metro Joint Policy Advisory Committee on Transportation (JPACT) earlier last week. They approved $36 million in Metro spending on the IBR. Final approval by Metro is expected Dec. 2. The IBR project has requested $71 million total additional funding from both states.
Delayed timeline
Johnson let the two groups know that his team had heard them regarding their desire for more time, and more details before getting a final solution for the replacement bridge. He told the legislators that the latest they would have a solution would be July, after providing more information to “partners on both sides of the river.”
Various agencies are seeking modeling and studies on the potential impacts of increased transit, or how higher-priced tolling might reduce trip demand in the I-5 corridor. Metro and the SW Washington Regional Transportation Council (RTC) have what staff called “state of the art” traffic modeling capabilities.
Last month, ESG members Hardesty and Metro President Lynn Peterson authored a joint letter asking the IBR team to slow down. The same people pushing higher tolls to reduce travel demand, also express concerns about the impact those tolls would have on the poor and communities of color, and are seeking a program to possibly exclude these people from the financial harm tolling would cause.
“I think we really need to get a breakdown from the IBR team about what happens in each stage of the process,” said Shawn Donaghy, CEO of C-TRAN to the ESG. “If we make changes to some of the original Record of Decision from the CRC project as we move through IBR, what that means for the timeline, what that means for potential funding.” He called for a “deep dive” into the modeling so a very frank, transparent conversation about the options.
“There are people who don’t want this to happen regardless of whatever data and research you provide,” Lee Beyer (Oregon’s 6th District) told the bi-state legislators.
Earlier this month, a group of 16 Oregon-based groups sent a similar letter to what Hardesty and Peterson had sent. “The IBR must not expand the number of vehicle travel lanes, including auxiliary lanes,” they said. “The IBR project must prioritize the efficient movement of goods and people: by moving more people across the bridge via transit and safe and accessible active transportation options, while moving the same or fewer cars.”
The nonprofit 1000 Friends of Oregon has said, “The Interstate Bridge Replacement Project is an equity and climate disaster.” The No More Freeways group launched a new campaign asking Metro to withhold funding until the project team presents a more climate-friendly version of the project.
Trip demand and transit ridership
The IBR team briefed the two bodies on the travel modes used.The IBR program collected cell phone data available from 2016 to 2021 using a Big Data platform. Big Data uses sampled anonymized location records from smart phones and navigation devices in connected vehicles.
It was revealed that transit carries only 2 percent of the cross river trips. The IBR team used 2019 data because it is unknown what the long term impact will be of the pandemic lockdowns. How many people will permanently work from home is unknown.
Beyer called the data “fascinating.” He noted people are moving farther away from the I-5 corridor, presumably to access more affordable housing.
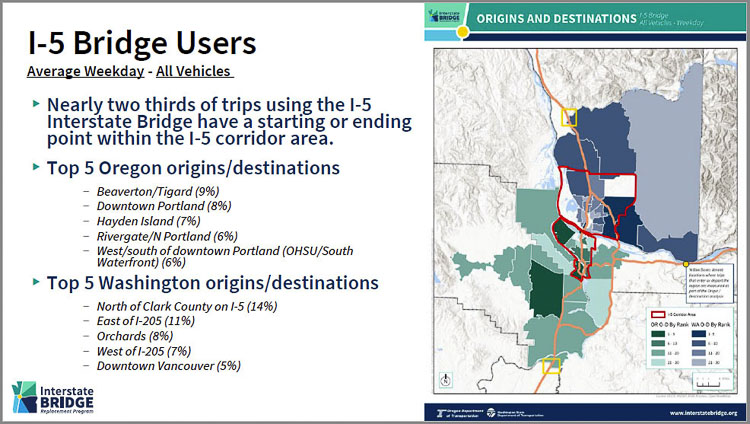
The largest number of Southwest Washington residents using the bridge came from north of Clark County — 14 percent of trips. Eleven percent of trips using the Interstate Bridge came from east Clark County — east of I-205. The largest destination was Washington County in the Beaverton/Tigard area, with downtown Portland second.
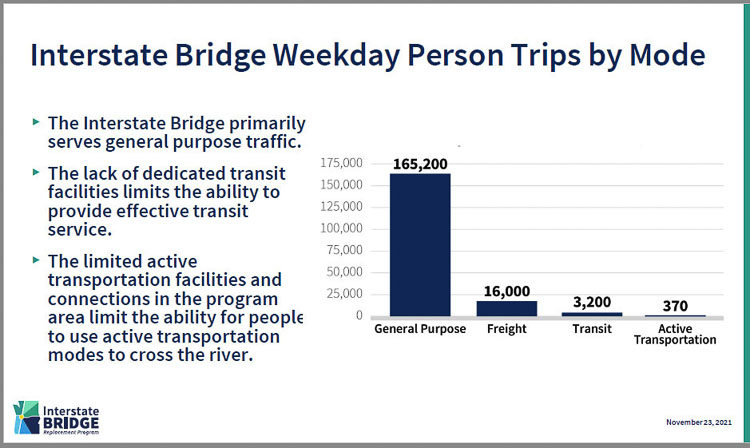
The Interstate Bridge primarily serves general purpose traffic. Legislators were shown data indicating there are 165,200 daily general purpose trips across the Interstate Bridge. There are 16,000 freight trips, 3,200 transit trips, and 370 active transportation trips (walking and bikes).
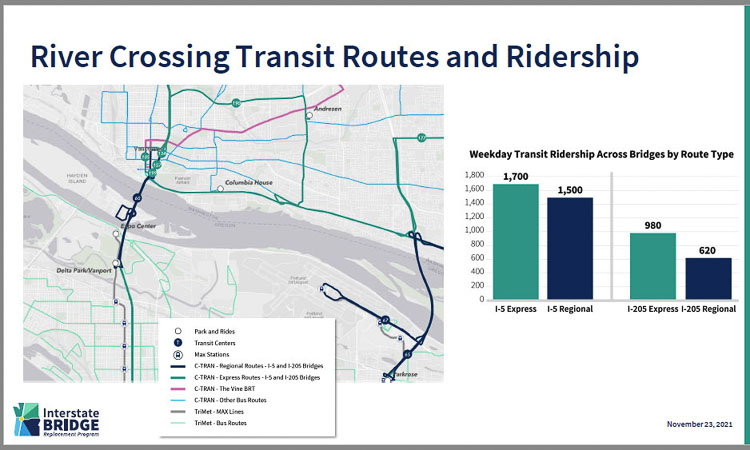
With transit handling only 2 percent of weekday cross river trips, one might wonder what the need is for “high capacity” transit. C-TRAN ridership peaked in 1999 and TriMet ridership peaked a decade later. TriMet’s Yellow Line carries just 11 percent of light rail ridership, fourth of the five lines. MAX ridership peaked a decade ago, shortly after the Green line opened.
The IBR staff shared that there are 3,114 park and ride spots in the region. Utilization runs the gamut, from 99 percent usage at the Gateway transit center in east Portland and 97 percent at the Parkrose site. The Expo Center utilization is just 48 percent.
In Clark County, there are more of them, but utilization is much lower. Fishers Landing has the largest number of stalls, but only 65 percent are used. Salmon Creek use is 50 percent and 99th Street is 55 percent utilized. The Vancouver Mall location is only 15 percent utilized.
Freight made up 8 percent of Interstate Bridge traffic in 2005 and has grown to almost 10 percent in 2019. Total freight trips using both bridges in 2019 is 25,300 vehicles. Total general purpose trips totalled 286,700 vehicles per weekday.
Sixty percent of freight trips from Washington began north of Clark County. Thirty percent of Oregon bound freight went south of the tri-county Portland metro area.
None of the top five morning Washington originations was in the downtown area of Vancouver. The Orchards area was tops at 11 percent, east of I-205 and north Clark County were the top three. The Salmon Creek area was fourth.
Three bottlenecks were highlighted in the program area. The Rose Quarter bottleneck was not mentioned, presumably because it is outside the program area. However it was noted that the I-5 corridor was congested 7 hours a day from south of downtown Portland through the bridge area.
The people want traffic congestion relief and saving time in their travels according to numerous surveys, including those done by the IBR. The 2018 PEMCO survey (pre pandemic) indicated 94 percent of people preferred to use their private vehicles.
Johnson indicated the delay was because some of their partners wanted them to study what might be possible to reduce automobile usage. “What could we do to change the demand for automobile usage in the corridor,” he said. “They wanted us to look at the land use planning in Oregon, near the bridge. They wanted us to look at the impact of higher rates on the congestion pricing that ODOT is currently looking at on their system.”
In the failed Columbia River Crossing project, transportation architect Kevin Peterson revealed there would be 288,000 daily movements on the I-5 corridor by 2058, and 261,000 daily movements on the I-205 corridor. That is 549,000 daily vehicle movements less than four decades from now. Those projections were made using data that is now 15 years old.
Sen. Beyer offered a summation at the end of the meeting. He appreciated the transportation demand presentation, but it wasn’t clear to him that the IBR team and legislators were looking to the future.
“We’re building the bridge, or trying to build a bridge that will be a 100-year bridge,” he said. “As we’re looking at what the capacity or demand for that bridge is going to be into the future, I think we need to make sure that we’re looking ahead and say what is that going to be for another 10 or 20 years? It’s gonna be hard to go back and adjust that bridge once it’s built.”
Washington Rep. Jake Fey (Democrat, 27th District) sought confirmation on the timing for a final decision. “When does the decision get made as to how many lanes, how many collector distributor lanes (auxiliary lanes) that are going to be, what the transit form is going to be?”
Johnson responded that they had hoped to have the decision done by March. But now under “the worst case scenario, this information proposal will go forward no later than July,” he said.
An April 2018 Oregon Transportation Commission survey indicated only 3 percent of Oregonians wanted tolling to go to/from Washington. The majority of people wanted an expansion of interstate freeways and interstate bridges. The IBR team has an online public survey open through Dec. 10 seeking input on bridge design options and transit.
Several citizens offered public comment. Clark County resident Mike Worthy represents freight haulers. He shared that the gridlock of the metro area harms truckers who are only allowed to spend a specified amount of time behind the wheel each day, but they get paid by the mile, not how much time they’re on the road. They need congestion relief.
He also shared “truckers are experts at avoiding tolls,” inferring that they will seek the least costly routes, but that if they have to pay tolls, it be done in a way that keeps them moving the fastest.
Bob Ortblad pushed the legislators to reconsider a submersed tunnel and Dave Rowe pushed for more and faster transit. Sarah Iannarone of The Street Trust said the planet will be destroyed if vehicle miles traveled aren’t reduced and sprawl isn’t stopped.
The 16 legislators will meet again on Dec. 6, but have no meetings scheduled next year, as both legislatures begin sessions. The Washington State Legislature begins a planned 60-day session on Jan. 10, with the Oregon State Legislature beginning on Feb. 1.
Good article. Understand that, yes, the public survey is open, but it does not present any options other than three through lanes in each direction, just variations of this. Article indicates that if the decision is not made by July then some funding will not be available. Is this correct? Does it seem that the EAG and the Bi-State Legislative Group are looking at this differently where one wants an answer now and the other wants to know that transit times will be substantially reduced? I am still confused. The article addresses the I-5 corridor traffic through Portland. First time I have seen an article address this. Thank you. I think this is the elephant in the room or the crux of the matteer (or even the cart before the horse). With the federal infrastructure passage, is there any consideration for improving this transit network or will we just lament an opportunity lost?
Tom:
So many appropriate questions.
“Article indicates that if the decision is not made by July then some funding will not be available. Is this correct?”
While that was not specifically mentioned, it certain was implied. They know those states “first in line” for all the various federal dollars will more likely be successful than those “late to the table”.
That said, there is also another deadline looming. The 2024-2025 requirement to have a project approved and moving forward, or be forced to pay back the roughly $140 million the federal government paid the two states for the CRC. But nobody specifically asked about that either.
re: “Does it seem that the EAG and the Bi-State Legislative Group are looking at this differently where one wants an answer now and the other wants to know that transit times will be substantially reduced? I am still confused.”
The ESG in particular have extreme activists Jo Ann Hardesty and Lynn Peterson who would prefer to do NOTHING for cars and trucks. They most often voice the concerns of those wanting to slow down the project.
They would love a bridge that simply took care of transit, bikes and pedestrians. They both repeated do NOT want to expand vehicle capacity on the bridge or in the corridor.
I would suggest you watch the entire 3 hour meeting and decide for yourself. That being said, you also have to have information and perspective from past ESG meetings, past meetings of the Bi-state legislators meetings, and more, to truly fill in the puzzle.
Here’s the link. https://app.leg.wa.gov/committeeschedules?eventID=2021111173#//28113
I don’t want to be a buzz kill , But The I-5 bridge replacement is just a seismic requirement for the federal gov. It will not ease congestion . Portland act’s in unrealistic ways for short sided goals. To actually relieve congestion , you would have to move PDX to Scapoose , or south of Portland . Then add bi-ways , like west of Vancouver to Hillsboro , then bridges between I-5 and I 205.
““What could we do to change the demand for automobile usage in the corridor”
Why would any caring person want to reduce automobile usage?
Is it because they hate people having mobility?
Is it because they are so ignorant of reality that they think costly, inconvenient, polluting, transit is a viable replacement?
Or is it because they are incapable of looking at facts and fell for Al Gore’s climate scam? (and are too factually illiterate to know that transit uses MORE energy than cars per passenger-mile?
If the zealots truly wanted to reduce commuting they would:
>> Increase good jobs in Clark County by opening up the railroad corridor’s potential 10,000 jos
>> Lower housing costs in Oregon to stop driving Oregonians to Clark County. Simple stroke of the pen could eliminate Oregon’s putting most land off limits to affordable housing.
Thank you for the chart of the ridership breakdown, public transit just 2% of commuters. Yet in the prior CRC bridge plan, gold-plated light rail costing ~ 25% of project costs was pushed instead of busses. OR built the Tillamook crossing over the Willamette River with NO LANES for general traffic, dedicated to light rail mostly, a few buses, pedestrians and bikes. See the Riverview Community Bank weather cam view of the Tillamook crossing https://www.kptv.com/weather/ Busses are more flexible in vehicle size and route, and the lane used can be shared with other types of vehicles, like freight, or emergency vehicles, carpool etc. Busses are also more economical than light rail, at a much, much lower cost per rider. I wonder about the accuracy of the 10% freight. At some hours of the day, it seems much higher than that. What are the weekday hours that trips are counted in, and the method of counting? Why are weekends excluded, when the percentage of frieight usage is likely higher? Does General traffic also include commercial vehicles delivering goods and services? Thank you for including the public input options, and please do keep including that in every report on this topic.
The Tillicum Crossing bridge is the newest of the dozen bridges that cross the Willamette River in Portland.
TriMet, Oregon and the federal government spent an estimated $135 million to construct the 1,720 foot long bridge, which as noted, carries no cars. It was part of a larger, $1.5 billion 7 mile expansion of TriMet’s light rail into Milwaukie.