

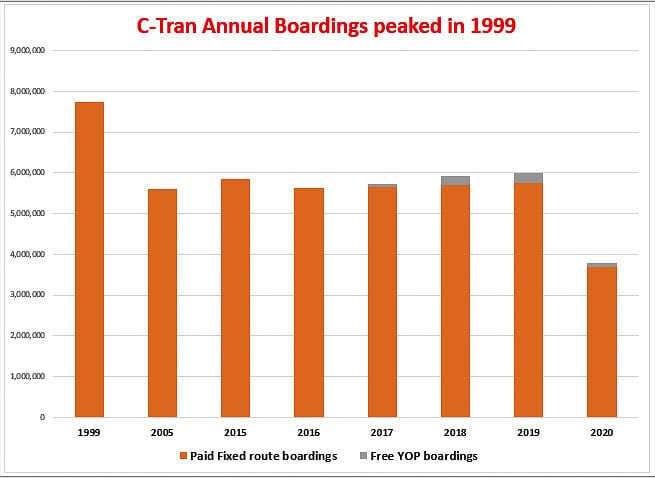
Free Youth Opportunity Passes help small ridership increase
C-TRAN ridership peaked over two decades ago at 7.75 million annual boardings. It has been a downhill ride for most of the ensuing years. Nationally, the federal DOT reports bus ridership declined 12.9 percent over the past decade while ridership on other modes of travel increased.
In three years just prior to the COVID-19 pandemic, there was a slight uptick in C-TRAN bus ridership. The lockdown due to the pandemic decimated transit ridership everywhere last year.
In its 2020 Annual Report, C-TRAN referenced a nationwide decline in transit ridership. However, C-TRAN says they experienced a smaller decline compared to most other transit agencies in Washington. Its 2020 financial report has not yet been published.
Overall in 2020, C-TRAN reports a total ridership of 3.8 million boardings. Of that, there were 3.44 million boardings on its fixed route system (Bus Rapid Transit, Local, Connector). The C-Van service had another 112,524 boardings.
This follows three consecutive years of ridership increases in 2017, 2018 and 2019.
Youth Opportunity Passes
In an effort to bolster ridership and help disadvantaged youth, C-TRAN began a program in 2015 offering free bus passes to selected Evergreen and Vancouver high school students. The program was expanded in 2017, and last month it began offering free passes to Clark College students. The program is known as the Youth Opportunity Pass for high school students and BackPASS for Clark College students.
According to C-TRAN, Evergreen and Vancouver districts each received 5,000 passes.
Battle Ground received 2,500 passes, and Camas and Washougal received 1,500 each. With the expansion, Clark College received 1,398 passes. The Washington State School for the Blind and the Washington School for the Deaf each got 50, and Next Success got 25. That’s 17,023 YOP and BackPASSes.
How many trips have students taken using the YOP free passes? C-TRAN reports “boardings” on its system. Usually, one person boards on the way to their destination, and again on the trip home. But if a person transfers to another bus, then it’s two boardings each way or four per trip.
• Sep. – Dec. 2017 — 61,123
• Jan. – Dec. 2018 — 224,711
• Jan. – Dec. 2019 — 235,160
• Jan. – Dec. 2020 — 89,230
In 2018 and 2019, those numbers represent just shy of 4 percent of all C-TRAN fixed route boardings.
C-TRAN values the YOP at more than $300. It does not offer access to any Regional or Express service that crosses into Portland, or paratransit service. It is not valid on TriMet or the Portland Streetcar.
C-TRAN shared that from Sep. 2017 to Nov. 2019, use of the Youth Opportunity Pass was recorded separately from ridership captured by the Automatic Passenger Counters. The Vine is not included in this data through Nov. 2019. As of Dec. 2019, all Youth Opportunity Pass usage is recorded by Hop and is inclusive of all routes.
Cross-river “commuter” service
Over 70,000 Clark County residents work in Oregon. C-TRAN offers the only cross-river service into Portland. In 2020, it had 249,638 boardings on the “commuter” service, with the average weekday having 971 boardings according to C-TRAN. This continues a decline in ridership on their express service to Portland that began earlier in the decade.
Last fall, C-TRAN reported “Commuter ridership has declined 58.2 percent (due to COVID-19). Commuter ridership includes Express bus routes only.” Asked how much express ridership has increased from its lowest levels, C-TRAN reported: “The sum of the average previous five weeks ending May 16, 2020 compared to the same period ending the week of Sept. 26, 2020 reflects a 23.7 percent increase in commuter boardings.
Average weekday ridership:
- 2016 – 3,040
- 2017 – 2,874
- 2018 – 2,844
- 2019 – 2,892
- 2020 — 971
The recent INRIX survey reported regional trips to downtown Portland declined 77 percent last April, 69 percent in September, and 65 percent in December. The February 2021 year-over-year decline was 66 percent. Portland had the 14th worst traffic congestion in the nation.
C-VAN Service growing
The one area of C-TRAN service that has been growing is its C-VAN service for seniors and citizens with disabilities. Last year, there were 112,524 boardings on this service as all people, especially senior citizens stayed home and isolated due to the pandemic.
In 1999, C-TRAN experienced 188,269 boardings in its “demand response” C-VAN service. Twenty years later it had 269,341 boardings, a 43 percent increase.
C-TRAN has increased their miles driven and hours of service since 2016, hoping to attract ridership. Longer term, hours of service have been essentially flat for the past two decades, while miles driven has declined 9.8 percent. In 2019, C-TRAN had 308,622 hours of bus service driving 4,756,154 miles. In 1999, C-TRAN had 310,981 hours of service and drove 5,275,297 miles.
C-TRAN’s operating hours have risen from 279,432 in 2010 to 308,662 in 2019. That’s a 10.4 percent increase in its hours of service. Net operating costs have risen from $28.2 million in 2010 to $43.6 million in 2019 — a 54.6 percent increase in costs.
Median per capita income in Clark County has risen 43 percent from $37,280 in 2010 to $53,423 in 2018 according to C-TRAN. That increase in income allows people to not only buy cars, but to also buy homes.
Across the river in Portland, TriMet has experienced a 60 percent decline in ridership from a year ago due to the pandemic. That equates to about one million fewer riders — 1.7 million in Feb. 2020 versus about 760,000 last month.
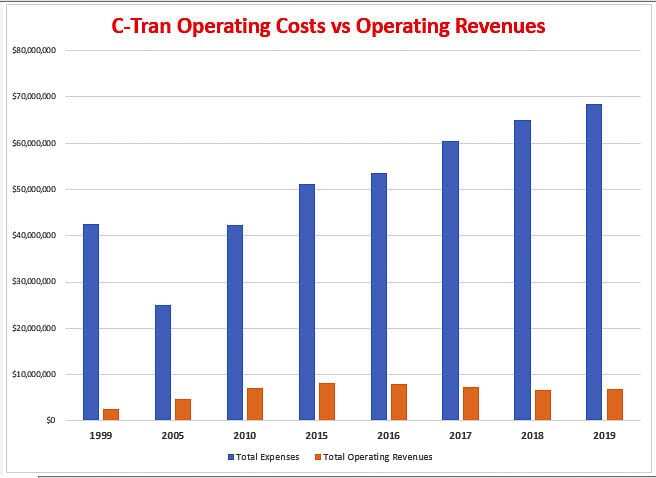
Today, about 85 percent of C-TRAN’s operating revenue comes from local sales taxes. The rest comes from passenger fares, grants and other sources.
C-TRAN had revenue of $29.1 million in 1999, the year ridership peaked. The latest financial statement (2019) indicates it had $75.3 million in operating revenue, over 2 1/2 times the 1999 operating revenue. Had that $29.1 million simply kept up with inflation, it would be $45.2 million in 2020.
The Farebox Recovery Ratio is a metric used to show what percentage a passenger fare covers of the operating costs. In 2019 that was 14.2 percent, down from 21.6 percent in 2015. It is calculated by dividing operating revenue by operating costs. In 2019, the Farebox Recovery Ratio decreased by 0.9 percent due to Operating Revenue growing at a lower rate than Operating Cost.
In 2005, farebox recovery was 23.2 percent and in 1999 it was 12.2 percent.
C-TRAN compares poorly with national transit farebox recovery results. According to the DOT, for each dollar spent on operating costs per trip across all modes and all transit systems, 32.3 cents are recovered through passenger fares. In comparing just bus service, commuter bus service fares covered 49.1 percent of costs and motorbus service covered 20.9 percent. C-TRAN’s farebox recovery was just 14.2 percent.