

How many vehicles would have to be removed from the Interstate Bridge to improve congestion?
By 2060, there might be 290,000 daily vehicle movements on the I-5 corridor. There may also be over 260,000 vehicles on the I-205 corridor. They act as a system, handling north-south travel and freight movement. How does WSDOT and ODOT plan to handle these 550,000 plus vehicles? That’s an increase of 250,000 vehicles above today’s level of traffic.
All of them are likely to be electric powered if Governors Jay Inslee and Kate Brown are right, mandating 100 percent of vehicles not be powered by fossil fuels well before 2060. But both the Southwest Washington Regional Transportation Council (RTC) and Portland’s Metro agree there will be a significant increase in the numbers of automobiles on the road in 2040.
Portland Commissioner Jo Ann Hardesty said last week “If we tell ourselves, we have no power to change things, then guess what, we really have no power to change things,” Hardesty said. “We’re actually building for 50 years into the future, this conversation would be going differently.”
By 2070, 50 years into the future, there could be an estimated 610,000 vehicles seeking to cross the Columbia River if the growth that was projected for the Columbia River Crossing (CRC) is continued into the future. The ODOT and WSDOT officials projected annual growth of roughly 5,100 vehicles crossing the river each year.

Interstate Bridge Replacement Program (IBR) Administrator Greg Johnson has promised to be “data driven.” That is what Governors Kate Brown and Jay Inslee promised when creating the program just over two years ago. His team will conduct a tolling and traffic analysis later this year, after a specific bridge design is chosen as the Locally Preferred Alternative (LPA) for the project.
Johnson closed out the tolling discussion at the Executive Steering Group (ESG) meeting last week by saying his team is looking very closely at whether or not, and by how much, tolling can impact demand. “If we can change demand, by doing some of these things, we will come back to this group and say, this is what we found,” he said. “If we can’t change demand, on the other hand, we will come back to this group and say, This is what we found.”
Several members of the ESG were interested in using tolling to reduce demand, by creating a financial incentive for people to avoid driving. Vancouver Councilor Bart Hanson worries we’ll be creating “roads for the rich” if the price of tolls is too high.
The data on traffic
The IBR team will do a tolling and a traffic analysis later this year, but after they propose a final design for the bridge. Portland bridge opponent Joe Cortright has lamented that they will be doing the opposite of what Gov. Brown promised – a traffic analysis prior to determining the best solution.
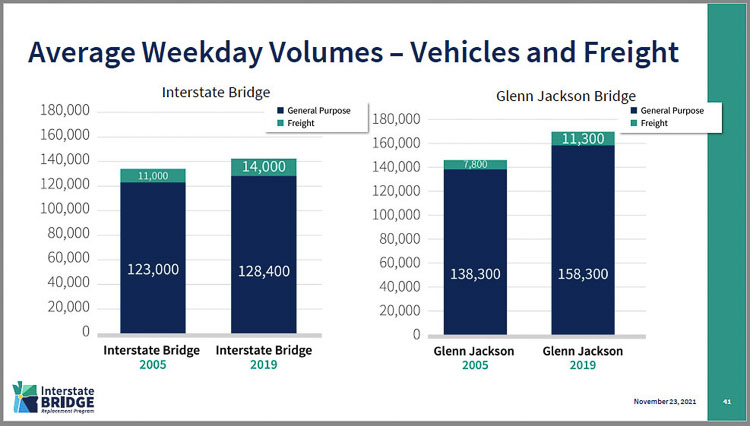
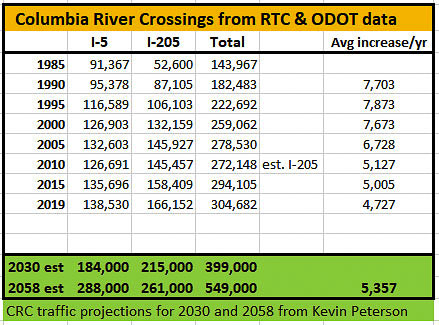
According to the RTC, the number of vehicles using both the Interstate Bridge and the I-205 Glenn Jackson Bridge was over 304,000 in 2019, prior to the pandemic. The Interstate Bridge carried 138,500 vehicles and the Glenn Jackson Bridge carried 166,100. Traffic volumes have returned to “near” normal as the pandemic enters its third year.
ODOT reported that the I-5 bridge corridor had exceeded its design capacity in the mid 1990s. They further reported that the I-205 corridor had reached its design capacity limit a decade later, in the mid 2000’s.
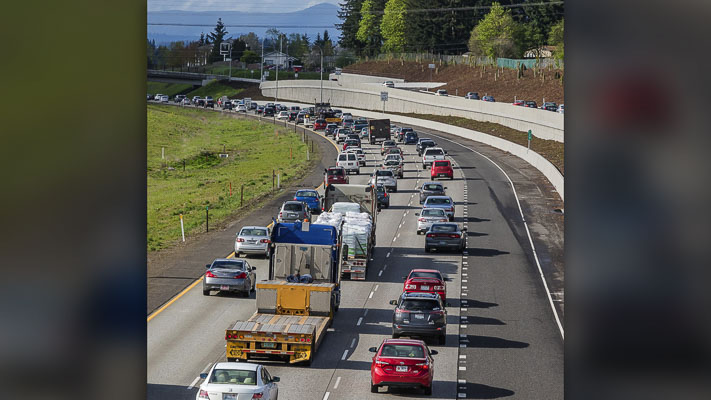
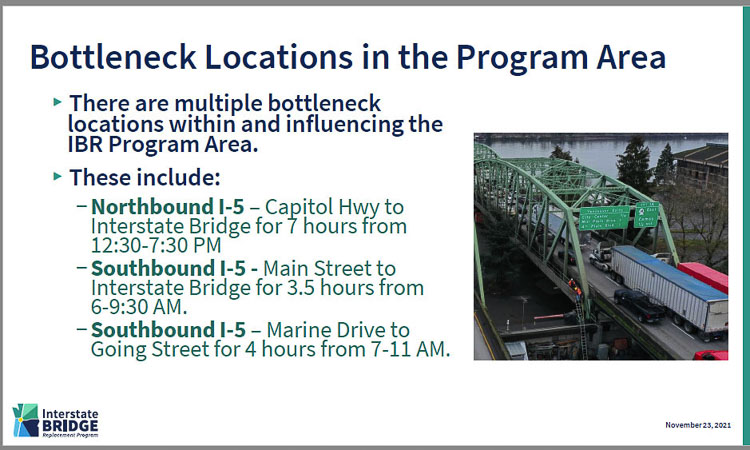
The IBR team reported last fall that the northbound I-5 corridor is congested and a bottleneck seven hours a day, from 12:30 p.m. to 7:30 p.m. The southbound I-5 corridor is a bottleneck five hours a day, from 6 a.m. to 11 a.m.
The Columbia River Crossing (CRC) traffic projections used 2005 and 2008 data according to transportation architect Kevin Peterson. They indicated in 2030, the Interstate Bridge would carry 184,000 vehicles and 288,000 vehicles by 2058. The Glenn Jackson Bridge would carry 215,000 vehicles by 2030 and 261,000 by 2058. That indicates our north-south system would need to handle 549,000 vehicles just 26 years after the expected opening of the replacement Interstate Bridge.
Citizens might wonder what our regional transportation planners are doing to handle that “old” projected increase of 250,000 daily vehicles crossing the Columbia River by 2060? Is it realistic to expect tolls to eliminate nearly one quarter million vehicles crossing the river each day?
Our RTC estimated the majority of the 30,000 increased daily trips across the Columbia River in 2040 would be by auto, in their 2019 Regional Transportation Plan (RTP).
“For trips to Oregon in the 2040 RTP, 86.3% are forecast to be taken by auto, 12.3% transit, and 1.4% non-motorized. The number of Clark County residents crossing the river to Oregon in 2015 is about 170,000 daily and 200,000 daily in the 2040 RTP which includes an I-5 bridge replacement. By 2040 the transit use is forecast to nearly double.
If the RTC is correct in their assumptions, an additional 25,800 trips (86 percent) will be made across the Columbia River using privately owned vehicles. If transit ridership doubles (opposite the C-TRAN experience of declining ridership on express buses), then 3,600 trips would be using transit.
“It’s going to be multimodal, because we know that the highway mode can’t handle all of the current and future needs through this corridor,” Johnson told CCT editor Ken Vance last fall. (Ken’s column here).
“We know that there has to be other outlets and also other outlets like high capacity transit,” he said. “They look like walking and biking. They look like connecting and moving people in a way, that takes some of the pressure off of the automobile mode all together.”
“Now, make no doubt about it, we know that currently there’s 143,000 folks in cars that want to get through this corridor,” Johnson said. “We are not going to build something that is going to seek to punish them out of their vehicles. But what we’re looking to do is give people alternatives.”
How many people can transit handle?
The people have not said they want “alternatives;” they want to save time, driving in their privately owned vehicles. The data shows that. The 2018 PEMCO survey showed 94 percent of people in Portland and Seattle metro areas prefer their cars.
Three extensive community surveys conducted by Johnson’s team indicate 7 out of 10 people want to save time driving their cars; 78 percent in SW Washington.
Oregon Sen. Lew Frederick asked Johnson “how much time will people save?” The response was a convoluted ‘not much,’ as Johnson tried to thread a needle of people pushing to add no new lanes to I-5, which include Metro’s Lynn Peterson and Portland’s Hardesty.
Interstate 5 and I-205 function as a system, providing north-south transportation capacity for Oregon and Washington. How many vehicles would have to be removed from the two freeways in order to save people enough time to provide value for a $3 to $5 billion investment?
C-TRAN has offered the only cross-river transit service in the metro area, with seven separate express bus lines. Ridership has been in decline for years, even prior to the pandemic.
Average weekday ridership on express routes to Portland:
- 2016 – 3,040
- 2017 – 2,874
- 2018 – 2,844
- 2019 – 2,892
- 2020 — 971
That 3,040 “ridership” number means 1,520 single occupancy vehicles were taken off the road in 2016. While every little bit helps, the 1,520 vehicles is a rounding error on the over 300,000 vehicles using the two bridges each day.
Last summer, C-TRAN announced permanent cuts in all their service areas, including reducing cross-river bus service by roughly half. Ridership had declined by 58 percent at one point. Portland’s TriMet announced they don’t expect their transit ridership to return to pre-pandemic levels for six years.
C-TRAN bus ridership peaked in 1999 at 7.75 million annual passenger boardings. It’s been hovering around 6 million boardings for the past few years. TriMet ridership peaked in 2012 and had lost over 5 million annual originating rides by 2019. The TriMet system currently has 1 million fewer boarding riders daily than before the pandemic.
Oregon Transportation Commissioner (OTC) Robert Van Brocklin recently said only 4 percent of people in Portland use transit. Other data indicates while some Portland neighborhoods use transit at a much higher rate, the broader metro area transit ridership remains low. Since the IBRP is a regional issue, how likely is it that the region will embrace greater transit ridership across the Columbia River?
An April 2019 OTC survey asked “what would you like transportation officials to do about traffic congestion?” The responses indicated 51 percent want to “expand and improve interstates and interstate bridges.” Another 14 percent want to “expand and improve arterials”. That makes 65 percent of Oregon respondents want to expand vehicle capacity and improve roads.
Only 3 percent of respondents to the OTC survey supported tolling to and from Washington. Transit was supported by 11 percent, and carpooling and/or changing travel times was supported by just 6 percent.
Is it possible for Johnson’s team to provide “incentives” for 50,000 or 100,000 people to give up their privately owned vehicles and ride transit or their bicycles? The data shows people are avoiding transit in ever greater numbers. The data shows citizens on both sides of the river want expanded “bridges and freeways.”
RTC’s 2040 plan
The RTC projects transportation and travel demands into the future for Southwest Washington. Their 2019 RTP for 2040 shows automobile use as the overwhelming choice both now and in 2040, nearly a decade after a new Interstate Bridge opens.
Vehicle miles traveled (VMT) on an average weekday in Clark County in 2015 totaled about 8.3 million. By 2040, VMT is forecast to grow nearly 50 percent to over 12 million daily VMT.
In looking at mode choice, in 2015, 90 percent of all trips generated in Clark County were taken by auto, 1.6 percent transit, and 8.4 percent non-motorized (pedestrian or bicycle). The 2040 RTP forecasts 89.7 percent trips taken by auto, 2.2 percent transit, and 8.1 percent non-motorized.
The RTC still believes cars will be the top choice for transportation in 2040. Metro agrees as well with their RTP projections.
For trips made to Oregon in 2015, the RTC reports 93.2 percent were auto, 5.7 percent transit, and 1 percent non-motorized. In the 2040 RTP, 86.3 percent are forecast to be taken by auto, 12.3 percent transit, and 1.4 percent non-motorized. Note the optimistic 115 percent increase in transit ridership.
The number of Clark County trips crossing the river to Oregon in 2015 is about 170,000 daily and 200,000 daily in the 2040 RTP which includes an I-5 bridge replacement. By 2040 the transit use is forecast to nearly double. The estimate appears to show roughly 25,000 transit trips of 200,000 total crossing the river.
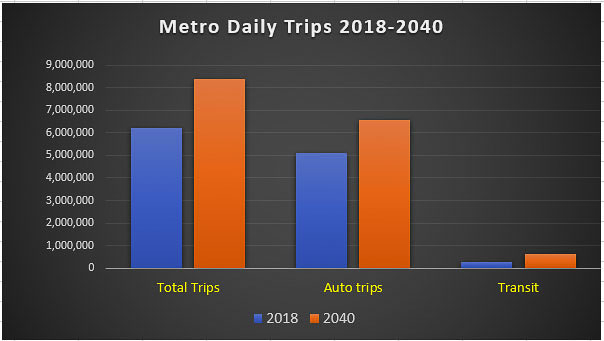
Portland’s Metro also has projections for 2040 in their RTP. They show a modest increase in transit ridership, compared to 2018. But the overwhelming majority of Portland area people will continue to travel via privately owned vehicles.
Total daily trips will increase by over 2 million, roughly one third of the 6 million daily trips in 2018. While Metro projects TriMet’s transit ridership will more than double by 2040, it handles well under one million of the 8.5 million total projected daily trips.
Bikes and pedestrian travel are and will remain rounding errors, when it comes to crossing the Columbia River. Johnson’s own data shows people using “active transportation” in the “hundreds,” not thousands, nor tens of thousands.
The IBR promises data is coming in the next few months. Will Johnson be true to the data? How will the IBR team, and how will ODOT and WSDOT propose to handle the 100,000 additional vehicles expected for 2030, two years before a replacement bridge opens? How will they propose to handle the expected quarter million more vehicles expected to cross the Columbia River in 2060?
Both Governor Jay Inslee and Kate Brown promised to be “data driven” when they created the agreement in Nov. 2019. Brown promised to get the data first, during the press conference. Sadly that hasn’t happened, two years into the project.
Johnson’s team promised a “data dump” was coming this spring, during last week’s meeting of the ESG. Citizens will be watching closely to see if the final proposal from Johnson’s team is data driven.