C-TRAN bus rapid transit is cheaper and could be faster for interstate transit service
The Interstate Bridge Replacement (IBR) team has added two new options to its list of transit proposals for consideration. Both new proposals extend TriMet’s MAX light rail into Vancouver, making six options for light rail, one hybrid option with light rail and bus rapid transit, three bus rapid transit (BRT) options, and one bus on shoulder (BOS) option.
The 16 legislators who make up the Bi-state Bridge Committee will meet Wednesday and also be updated on options for the Hayden Island community. Two choices appear to rise to the top, including one with full interchanges and one with partial interchanges.
The IBR program has chosen to identify six “problems” that need to be addressed, via its “Purpose and Need” statement. Those include a need for high capacity transit, “active transportation” improvements for walking and biking. Congestion relief, improved safety, and seismic resilience are people’s top priorities.
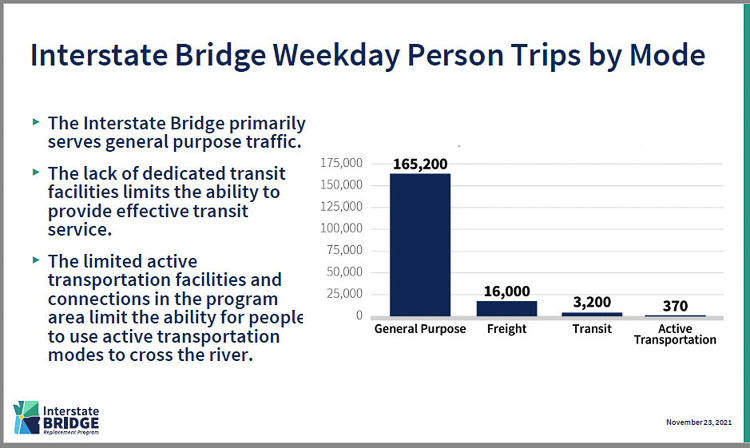
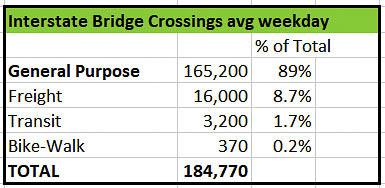
On an average weekday, 184,770 trips cross the Interstate Bridge according to the IBR team. Ninety eight percent of those trips are either general purpose vehicles or freight. Just under 2 percent are either transit or active transportation.
The last time traffic demand studies were completed was in 2005 and 2008 during the early part of the failed Columbia River Crossing (CRC) process. The IBR team won’t be conducting new traffic projection studies until after it has made a revised Locally Preferred Alternative recommendation.
By 2060, there could be 290,000 daily vehicle movements on the I-5 corridor. There may also be over 260,000 vehicles on the I-205 corridor. They act as a system, handling north-south travel and freight movement. How does WSDOT and ODOT plan to handle these 550,000 plus vehicles? That’s an increase of 250,000 vehicles above today’s level of traffic.
How many vehicles can transit take off the road? Is it possible for transit to reduce traffic congestion in the years immediately after a replacement bridge opens?
With just 2 percent of I-5 crossings being transit riders, it makes sense to focus on costs when considering options for transit on a replacement bridge. The IBR staff is telling citizens the capital cost of BRT is less than the capital cost of light rail.
TriMet has spent $200 million to $400 million per mile to create new light rail lines. Whereas The Vine BRT is six miles long, spending $50 million to build. The new Mill Plain BRT line will be about 10 miles long, costing $50 million as well. That is $5 million to $8 million per mile.
Operating costs 34 percent lower for BRT
Regarding operating costs, the IBR team members say light rail is cheaper to operate than BRT. But is it?
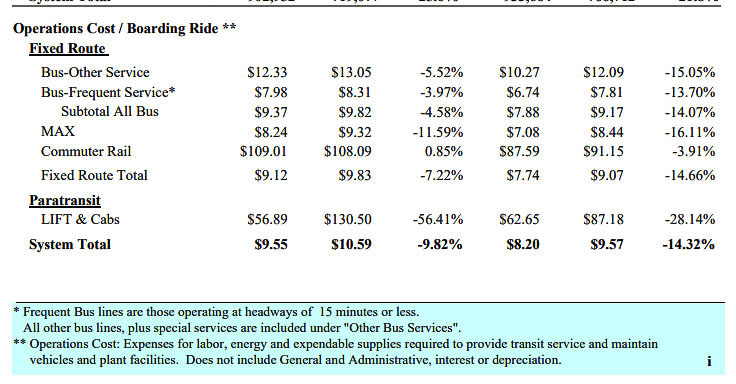
TriMet’s most recent annual report shows the MAX light rail “cost per boarding rider” to be $8.24. They also report that “frequent bus service” costs $7.98 per boarding rider. Frequent bus service is any bus route that offers headways of 15 minute or less. It costs less than light rail in TriMet’s system.
How does that compare with C-TRAN’s new BRT system, The Vine?
C-TRAN provided data showing they operate The Vine every 12 minutes during much of the day. That certainly is comparable to TriMet’s every 15 minutes or better metric.
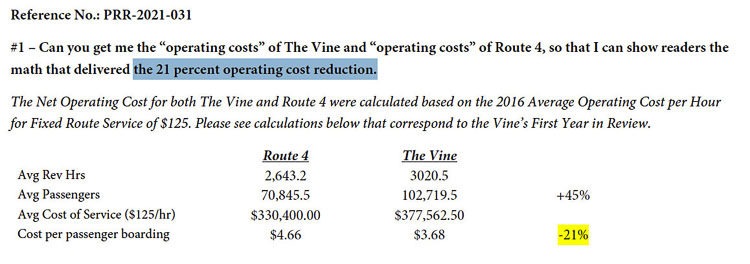
In 2016, C-TRAN officials told the Federal Transit Administration (FTA) they expected a 21 percent cost reduction on The Vine, compared to the cost of operating Route 4 at $4.66 per passenger. They expected the BRT “cost per passenger” would be $3.68.
Both are a bargain compared to the $8.24 per TriMet MAX light rail passenger. If C-TRAN delivered, that would be a 55 percent discount compared to MAX light rail.
In 2020, C-TRAN had much fewer passengers on The Vine than promised in their 2016 request to federal authorities. Nonetheless, it reported a $5.44 cost per boarding passenger in 2020. That is $2.80 less per passenger at C-TRAN. That is a 34 percent less operating cost for C-TRAN operations compared to TriMet’s light rail.
Will there be equity?
In the failed Columbia River Crossing (CRC) effort, Clark County citizens were significantly opposed to bringing TriMet’s light rail across the river. The IBR team members are studying “what has changed” since the 2013 failure, as they prepare to make recommendations.
They also have an “equity” committee that promises “to centering equity in our processes and our outcomes. We are engaging communities and elevating the voices of equity priority communities throughout our processes and ensuring these communities receive the program’s economic and transportation benefits. We also commit to not furthering harm to these communities.”
That’s especially important to Clark County residents who felt ignored in the failed CRC.They felt they would bear the financial burden of Portland’s demand to bring light rail into Vancouver, as well as an unfair financial burden in paying the $8 tolls. It was estimated Washington residents would be paying roughly 60 percent of the tolls in the CRC.
In 2012, CTRAN conducted a survey on light rail, which was rejected in every city in Clark County. The entire county was allowed to vote. In 2013, a county-wide advisory vote on light rail was held. Over 68 percent of voters agreed that voters should be allowed to vote before any taxpayer funds are spent to bring light rail into Clark County.
The Washington Policy Center noted at the time, people believed buses were more efficient than light rail. There was 2 to 1 opposition to raising sales taxes to support bringing light rail to Clark County.
The 2020 Census indicated Clark County had grown by nearly 78,000 people since 2010. The IBR team reports that 76 percent of that growth is among people of color. Housing affordability is a key reason many people moved across the river, as well as our perceived quality of life.
Transit ridership and “demand”
When it comes to transit ridership, what has changed is the number of people riding any of either the TriMet or the C-TRAN buses or light rail systems? C-TRAN ridership peaked in 1999 at 7.75 million annual boardings. TriMet system boardings peaked a decade later in 2009 with 49.9 million originating bus rides.
Over a dozen years later, C-TRAN had 5.9 million boarding in 2019, down from 6.2 million in 2013. TriMet had 43.5 million bus boardings in 2019 versus 45.2 million in 2013. And that was before the pandemic where both transit agencies experienced 50 to 70 percent declines in ridership.
What is the need for transit on the bridge? Why is “high capacity” transit needed, when there has been such severe declines in transit ridership, even before the pandemic?
C-TRAN had lost over 22 percent of their ridership before the pandemic. TriMet had lost nearly 13 percent.
TriMet was down to 21.1 million originating bus rides by 2021, a loss of nearly 58 percent from 2009. TriMet officials have informed citizens they don’t expect ridership to return to “pre-pandemic levels” for six years. That would still be below the 2009 peak ridership for their bus system.
If you combine TriMet’s bus and MAX light rail ridership, they peaked in 2012 at 79.7 million originating rides. They were down to 74.5 million originating rides in 2019, a 6.5 percent decline before the pandemic. In 2021, they were down to 39.7 million originating rides, a 50 percent decline.
What the people want
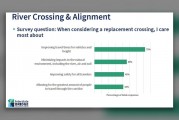
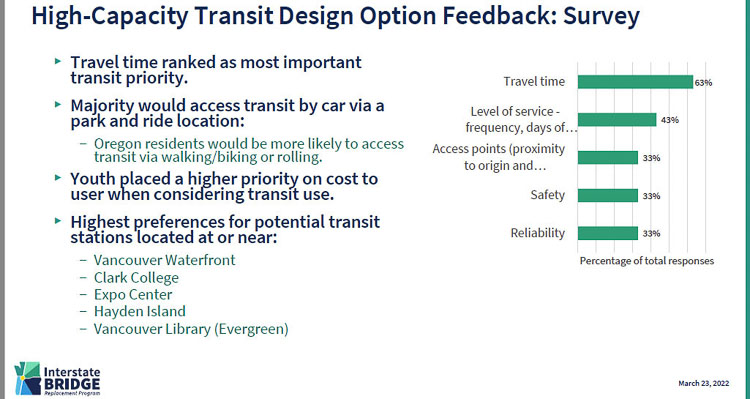
Multiple IBR surveys indicate citizens’ top priority is to reduce traffic congestion and save time. The desire to save time is equally shared by transit riders and those driving in their cars.
The most recent IBR survey indicated 78 percent of Washington residents want to save time and reduce congestion. It’s a higher priority for people on the north side of the Columbia River than it is for Oregon’s who still support it by over 60 percent. Seventy percent opposed tolling to pay for the project.
When it comes to transit priorities, 63 percent want to save time, 43 percent value levels of service, and 33 percent value access points, safety, and reliability according to the IBR.
How fast does MAX light rail travel? With stops roughly every mile as it travels down Interstate Avenue in north Portland, the Yellow Line averages about 15 miles per hour. All the businesses want a stop nearby. But that slows down the light rail’s average speed on its way to downtown Portland.
Contrast that with C-TRAN’s “express” bus service from Vancouver. Even in congested traffic conditions on I-5, it averages close to 30 miles per hour – double the speed of the Yellow Line. If buses were allowed to travel on the shoulder (BOS), it would shave a few more minutes off the transit trip time.
Since people want to save time, either on transit or while driving, the time-saving is clear. C-TRAN delivers passengers to their downtown destinations twice as fast as light rail. It also does it cheaper.
Greg Johnson’s responses to CCT
IBR Administrator Greg Johnson was asked for an update by Clark County Today, with a focus on the need for high capacity transit (HCT). Here is his response.
“Replacing the aging Interstate Bridge over the Columbia River with a modern, seismically resilient, multimodal structure that provides improved mobility for people, goods and services is a high priority for Oregon and Washington. The multimodal replacement bridge and program corridor will be designed to meet the transportation needs of the region, now and in the future. It will include capacity for vehicles (personal vehicles and freight trucks), transit, and active transportation (biking, walking, and rolling), with the goal of providing all travelers crossing the Columbia River with reliable and efficient options.
“The Interstate Bridge Replacement (IBR) program is currently evaluating design options in support of the development of a Modified LPA (locally preferred alternative). The components of the Modified LPA are expected to include recommendations for Hayden Island / Marine Drive interchanges, the number of auxiliary lanes, and recommendations for high-capacity transit (HCT) investments. The Modified LPA is a starting point for more detailed analysis and decisions as part of the Supplemental Environmental Impact Statement process, which includes extensive analysis and ongoing opportunities for community and stakeholder input.
“We are currently studying representative HCT investments in close coordination with our transit partners, C-TRAN and TriMet to better understand what type of transit investment would best serve the IBR program corridor and the region. This process has provided a deeper understanding of what has changed both physically and in planning processes since prior studies and has informed high-level conceptual designs and how the various transit investments might work within the built environment and IBR program corridor.
“Changes since prior studies include C-TRAN’s Vine Bus Rapid Transit network, including current operations and future expansion plans, and TriMet’s service area expansion. We are working with our transit partners and the City of Vancouver to further identify transit investments that will serve all travelers in Clark County, which has grown by nearly 78,000 residents since 2010; 76% of those new residents are BIPOC, which further justifies our program commitment to equity in all areas of our work.
“Initial findings from our data-driven process combined with community input has confirmed there is a strong demand for HCT service across the Columbia River. Draft findings of our analysis have shown that all transit investments under consideration significantly improve service over the no-build option, and that all transit investments improve access to jobs, including for BIPOC and low-income populations. These findings also suggest that transit investments will need to include a combination of Vine BRT, LRT, and express bus service. Transfers from other transit vehicles are the highest mode of access for all representative transit investments, highlighting the importance of conveniently connecting the C-TRAN and TriMet systems.
“Input from partners, advisory groups, and the community will be considered alongside technical analysis with measures including ridership demand, access for equity priority communities, relative costs, and high-level potential impacts as the program works to define the preferred transit investment for inclusion in the Modified Locally Preferred Alternative and further study in the federal environmental review process.’’
Also read:
C-TRAN’s BRT ‘savings’ for The Vine don’t appear to pencil out
C-TRAN ridership continues pandemic caused decline in 2021
Does C-TRAN need ‘high capacity’ and Bus Rapid Transit on The Vine?

Seventy-eight percent of Washington residents want improved travel times for Interstate Bridge project