



🎧 IBR’s Traffic Forecasts: A $15 Billion Miscalculation?
Joe Cortright says the IBR team is falsely claiming that the investment grade analysis is somehow an excessively conservative, low-ball, worst-case estimate, useful only for assessing financial risk
Joe Cortright
City Observatory
The Interstate Bridge replacement project’s investment grade traffic and revenue analysis shows the $15 billion project will be a waste of money that will serve fewer vehicles in 2050 than use the bridge today. And it will cause tens of thousands of vehicles to divert to the parallel I-205 bridge, increasing traffic, congestion and pollution.
The Interstate Bridge Replacement Program’s (IBR) generously funded public relations team is trying to divert attention from these inconvenient truths with a pat talking point: They’re falsely claiming that the investment grade analysis (a much more detailed, sophisticated and accurate set of models, required by banks and the federal government) is somehow an excessively conservative, low-ball, worst-case estimate, useful only for assessing financial risk. That’s simply untrue: Investment grade analyses have been much more accurate in practice that highway department forecasts, and importantly, haven’t been too conservative: traffic levels often fall well below investment grade forecast predictions. That’s been the case in Washington State, where both the major toll bridge projects–the Tacoma Narrows Bridge and the SR 520 Bridge in Seattle–have fallen far below their investment grade predictions.
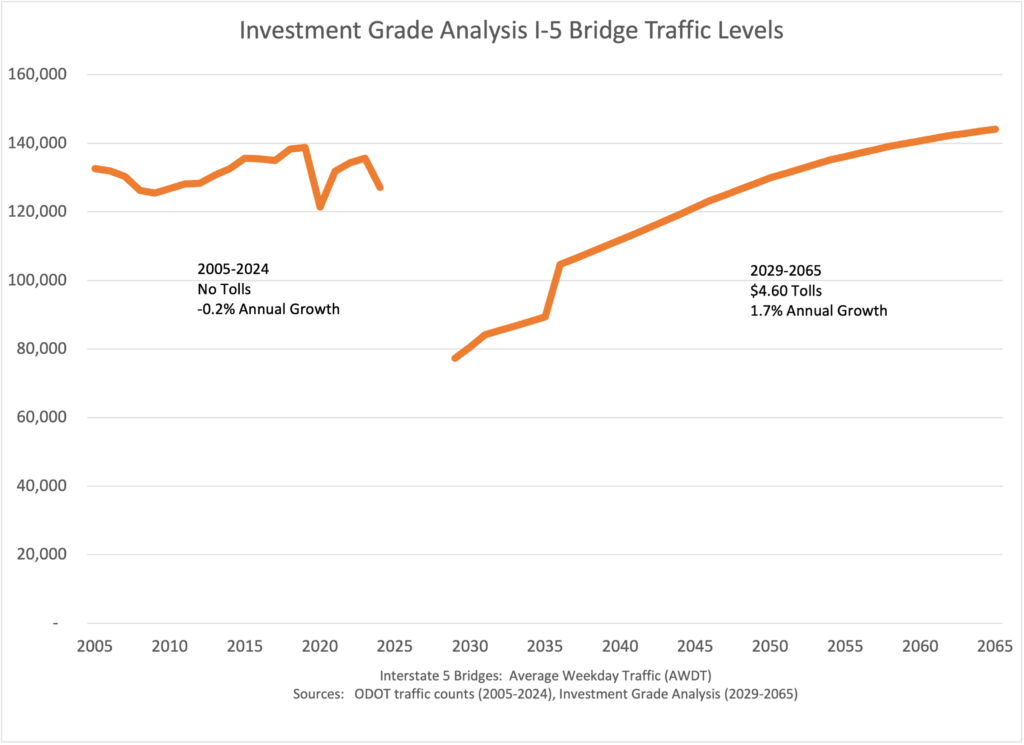
IBR claims we needed a bridge big enough to handle 180,000 vehicles per day. The results of the Investment Grade Analysis show charging $4.60 tolls to use I-5 will cause traffic to drop from 127,000 vehicles today to about 77,000, and traffic won’t recover to current levels for several decades. And even that is likely a wild exaggeration. And IBR has failed to disclose that tens of thousands of vehicles will divert to the I-205 bridge. These numbers are ominous for the project: What they mean is that with tolls, there’s no reason to spend literally billions to widen I-5 between Portland and Vancouver–that roadway will go largely unused for decades. At the same time, tolling the I-5 crossing will snarl traffic elsewhere in the region. This investment grade analysis shows that the IBR is a tragic and costly mistake that will squander billions and make traffic worse.
The two highway deparment’s are desperate to divert attention from these numbers–which they have been delaying for years. IBR’s talking point is these are “conservative” numbers, only to be used for financial analysis: “pay no attention to the investment grade forecast we just spent a couple of million bucks on.” They claim that the projections are a kind of “low-ball” or worst case analysis to conservatively estimate revenues, and can’t be used to characterize real world effects, especially traffic diversion. Willamette Week reports:
A project spokeswoman confirms the Stantec analysis does indeed show a large drop in daily traffic but says the numbers are a worst-case scenario. “Estimates for this financial analysis include an additional layer of conservatism to allow for a period of transition as the community adjusts to tolling,” she says. . . . “The traffic and revenue analysis work is an exercise to determine revenue projections and takes a fiscally conservative approach,” the project spokeswoman says. “[That] tends to project lower bridge usage so as to not overstate revenue potential.”
None of that is true. These expensive investment grade analyses are required by markets and the federal government precisely because state highway departments inevitably have “optimism bias” leading them to build over-sized, expensive facilities, and to count on toll revenues from traffic that never materializes. The whole point of an investment grade analysis is to not take on expensive debt that can’t be repaid because in reality, far fewer people will pay to take a tolled road than a free one.
Investment grade analyses are more accurate, more carefully researched and have lower errors than highway department modeling. That’s why WSDOT and ODOT spent $700,000 on a “Level 2” traffic and revenue analysis for the IBR in 2023, and spent a further $2.3 million, with the same company, Stantec–to produce a “Level 3” study over the past two years. The Level 3 study uses more detailed and sophisticated measures, particularly on “value of time” to estimate how traveler behavior will respond to tolls. And the Level 2 and Level 3 studies are much more accurate than DOT forecasts: The modeling IBR used for its EIS has an error six times greater than the Stantec Level 2 model, and consistently over forecasts current travel levels.
While they’re less inaccurate than highway department projections, the truth is that even investment grade analyses have optimism bias, and routinely over-estimate traffic on tolled facilities.
That’s certainly been the experience of WSDOT, Oregon’s partner in the Interstate Bridge Project. WSDOT has built two major bridge projects in the last couple of decades, and financed them substantially (though not entirely) with tolls. These are the Tacoma Narrows Bridge (built in 2008) and SR 520 Floating Bridge (built in 2012). Like the proposed IBR, both projects added tolls to a previously free crossing. In both cases, WSDOT hired consultants to prepare an “Investment Grade Analysis” of traffic and revenue of the projects.
And in both cases, the investment grade analyses seriously over-estimated future traffic levels. And not by a little, but by a lot.
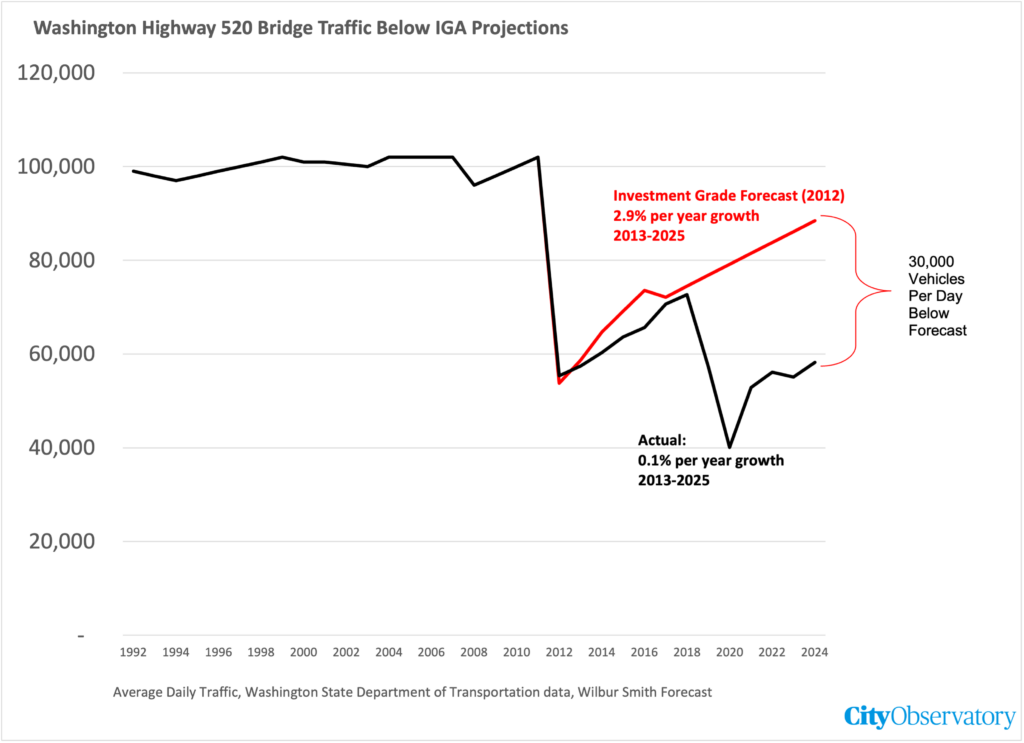
- Seattle’s SR 520 Floating Bridge, traffic fell by a third, and has never recovered, current traffic is 33 percent below levels forecast in the Investment Grade Analysis.
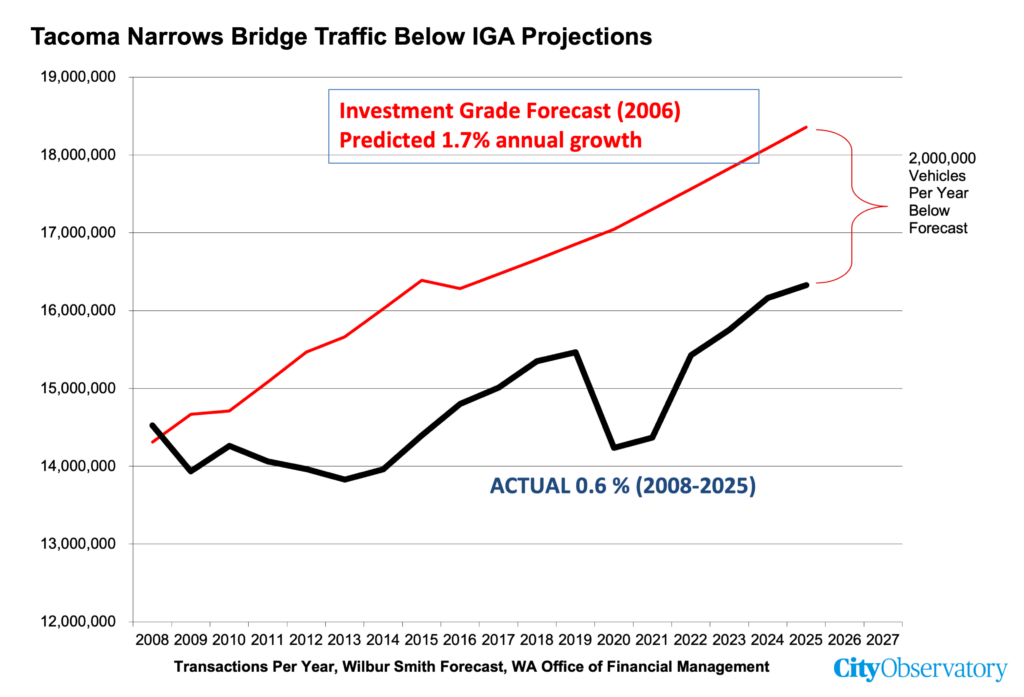
- Tacoma Narrows Bridge, traffic has grown at only one-third the rate (0.7 percent per year) of the level forecast in the Investment Grade Analysis.
Both of these bridges provide cautionary tales about the biases in traffic forecasting. Enough time has elapsed now—more than a decade in the case of each project—to allow us to reasonably compare forecasts to actual travel. There’s utterly no merit to the claim that Investment Grade analyses are unrealistically low, as state DOT officials proclaim.
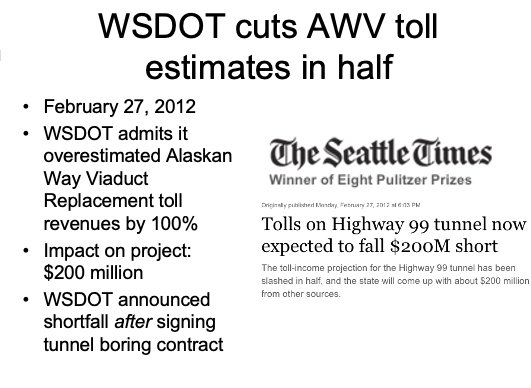
Similarly, WSDOT”s experience with tolls on the SR 99 tunnel under downtown Seattle—built to replace the now demolished Alaskan Way Viaduct—shows that forecasts are frequently wrong, and routinely over-estimate both revenue and traffic. When the project was authorized, WSDOT officials promised $400 million in bonds supported by toll revenues, but then—after construction was authorized—slashed the bond amount in half to $200 million because traffic studies showed revenue would be much lower than hoped for. Even then, the SR 99 bonds have had to be bailed out by the state legislature.
Investment Grade Analyses of tolled highway facilities do not tend to under-estimate future traffic levels; if anything, investment grade traffic and revenue studies tend to over-state future traffic levels and associated revenue. The claim that investment grade studies are “too conservative” implies that such studies routinely under-estimate traffic levels on tolled roads (i.e. that actual traffic levels are significantly higher than shown in the investment grade analysis). While the IBR asserts that this is true, they present no actual statistical evidence to show that investment grade studies under estimate traffic. In fact, studies that have been done show that actual traffic levels on tolled facilities are lower than forecast by these supposedly “conservative”.
Tacoma Narrows Bridge: 2 million cars below forecast
The second span of the Tacoma Narrows Bridge was opened in 2008. It was financed in principal part by tolls. Wilbur Smith and Associates prepared an Investment Grade Traffic and Revenue Analysis for WSDOT, which predicted that annual traffic—measured by vehicle toll transactions—would grow at a rate of 1.7 percent per year over the forecast period. Total transactions were predicted to grow from slightly more than 14 million to more than 18 million by 2025. In fact, annual transactions have been below forecast levels ever since 2009. Actual growth in transactions since the bridge opened have been 0.6 percent per year, barely a third of the growth rate predicted in the Investment Grade Analysis. Aggregate traffic growth has been less than half of the amount predicted, increasing by about 2 million transactions per year since the bridge opened, rather than about 4 million transactions.
SR 520 Floating Bridge:30,000 cars per day below forecast, continuing diversion to I-90
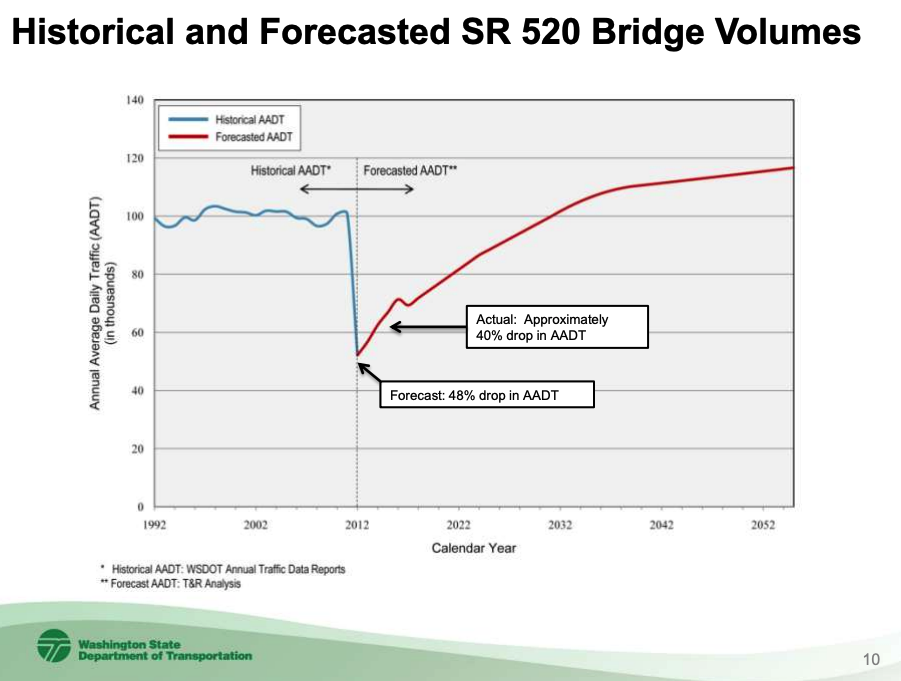
WSDOT completed the replacement portion of the SR 520 floating bridge in 2012, paying for the project in part with tolls, which are assessed on a variable basis. The investment grade analysis prepared by Wilbur Smith predicted their would be a sharp drop-off in traffic on the bridge when tolls were introduced, and that once that shock was over, traffic levels would grow at an annual rate of almost 3 percent per year. The forecast accurately predicted the initial decline in traffic, but over the past decade, has consistently under-estimated traffic growth. Traffic levels on the SR 520 floating bridge today are about one-third lower than predicted by the Investment Grade Analysis, about 60,000 vehicles per day, rather than the predicted 90,000.
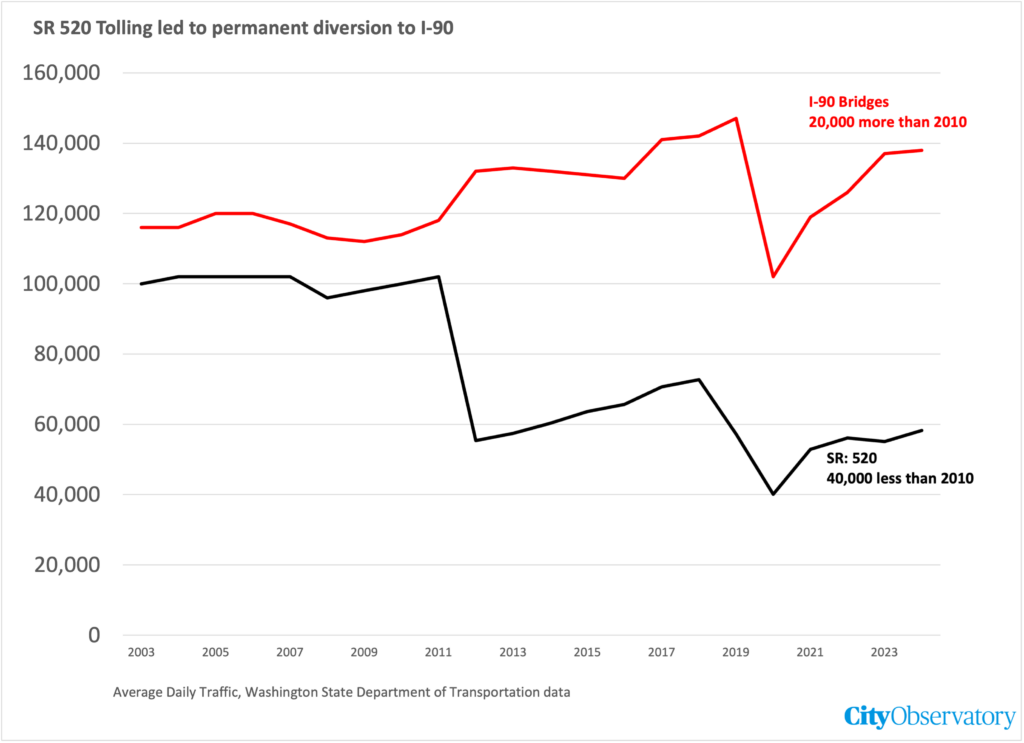
The SR 520 bridge is one of two crossing Lake Washington. Before it was expanded (and tolled) the SR-520 bridge carried slightly fewer vehicles than the parallel I-90 bridge, about 3 miles to the South (as the crow flies). Just before tolls were imposed in 2011, the I-90 bridge carried about 18,000 more vehicles daily than the SR-520 bridge. Since then, traffic has gone up on I-90 and gone down on SR-520. Today about 80,000 more vehicles use the I-90 bridge compared to the SR-520 bridge (138,000 vs. 58,000). The data also put the lie to claims that this is somehow all about Covid: both bridges saw a decline in 2020, but while I-90 fully rebounded to pre-pandemic levels, SR 520 has made up only half of the decline.
These data directly contradict claims that Assistant ODOT Administrator Travis Brauer made in testimony to the Oregon Transportation Commission on May 7, 2026. Without citing any data, Brouwer acknowledged that while traffic fell off after SR 520 was tolled, and traffic increased on the parallel I-90 route that somehow there was a “gradual increase” in SR 520 traffic, and that diversion was not “one-to-one”:
That is something that we’ll be bringing to you as part of this Level 3 work over time to understand what diversion looks like. And I will tell you, you know, I look back at, say, the tolling that was done on SR 520 across Lake Washington in Washington, and there’s a lot of ways it’s somewhat analogous. We saw after tolling was imposed on SR 520 a dramatic and instantaneous drop in traffic on SR 520 and that’s very consistent with what you will see in the level three traffic and revenue analysis. And yet, then what you see is a gradual increase in traffic going back to that route over time. What you see is that there are alternate routes to any toll facility that will see additional traffic. We saw that on the I-90 bridge, but it is not a one-to-one.
The reality, however, is that SR 520 traffic has gone down—and and stayed down—and not rebounded as the supposedly “conservative” investment grade analysis predicted. SR 520 is carrying 40,000 fewer vehicles than before tolls were introduced 14 years ago, a four times larger decrease than predicted in the IGA. Meanwhile, traffic on I-90 is about 20,000 vehicles per day higher than before tolling was implemented on SR 520, and the I-90 bridge carries a permanently larger fraction of cross-Lake Washington traffic that before. Tolls clearly produced sustained diversion, in addition to causing the total volume of traffic across Lake Washington to decline by about 20,000 vehicles per day.
Highway 99 Tunnel
The Highway 99 Tunnel in downtown Seattle (built to replace the capacity lost due to the removal of the Alaskan Way Viaduct) cost more than $3 billion. Originally, the project budget called for $400 million to be paid for by bonding toll revenues charged to tunnel users. After the project started construction in 2012, WSDOT admitted it had over-estimated potential toll revenues and the amount of bonds that could be supported from toll revenues was cut in half, to just $200 million, meaning more than 90 percent of the cost of the project was paid for from other state and federal funds.. Today, WSDOT charges time varying tolls of up to $2.80 for tunnel travel. About 50,000 vehicles per day use the tunnel.
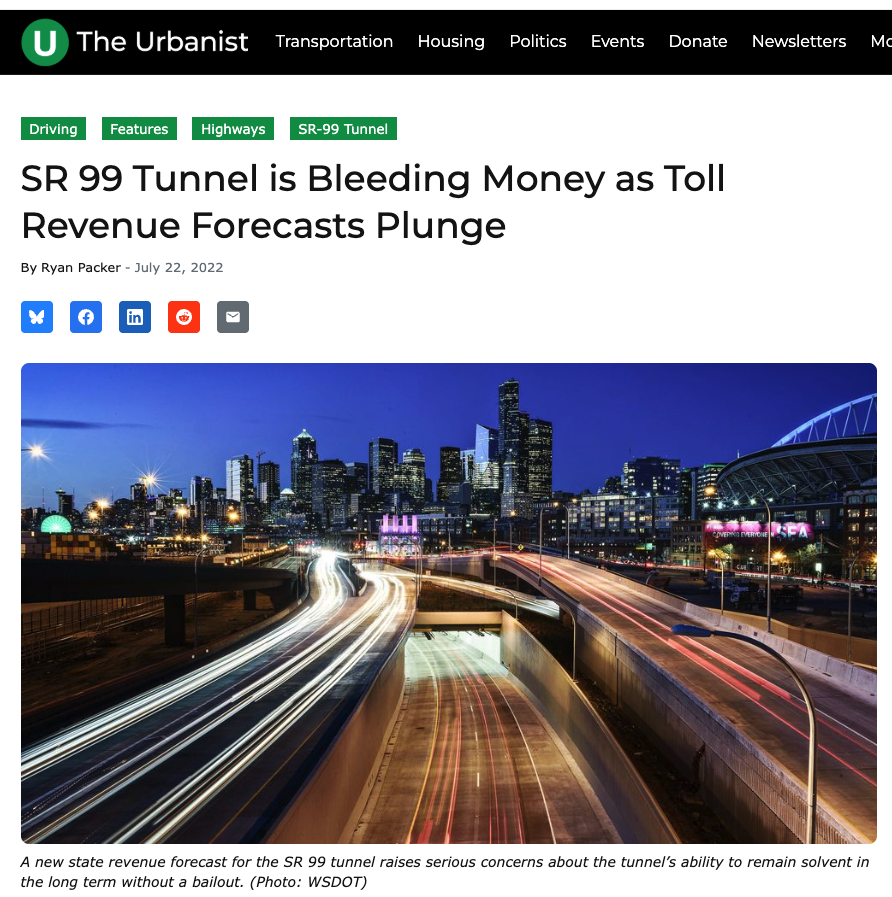
In 2022: the State Treasurer found that toll revenues were sufficient only to cover interest payments on bonds, leading the outstanding liability still more than $200 million initially borrowed. The State Legislature bailed out the toll bonds by reallocating a portion of the settlement with construction contractors to help pay off bonds.
The IBR model is less accurate that the Investment Grade Analysis
The Investment Grade Analysis of the IBR prepared by Stantec is based on Metro’s “Kate” regional travel demand model. A key way to check the accuracy of models is to compare their predicted levels of traffic in current years with actual data (compiled from traffic recorders). A key part of the Stantec Investment Grade Analysis was to check Kate’s predictions against current measured traffic levels. Stantec found that Kate seriously over-predicted existing traffic levels. (Technically the model is “poorly calibrated.”)
Model accuracy is expressed as the “root mean squared error” which reports the average percentage error in model predictions. The Stantec Level 2 analysis shows that the Metro Kate model is about six times less accurate than the Stantec Level 2 model. Kate has an RMSE of 14.5 percent, the Stantec model has an RMSE of just 2.5 percent.
The IBR continues to use the poorly calibrated Metro RTDM “for planning purposes” even though it substantially over-states actual traffic on the I-5 bridge. The Kate model is not merely less accurate: Stantec’s work shows that the model is significantly biased:
. . . limitations were identified in the RTDM assignment process that resulted in overestimated speeds and underestimated travel times along the I-5 and I-205 corridors near the river crossings. As such, additional refinements were performed to the base year 2015 traffic assignment to improve alignment with the observed data. These refinements were performed outside of the RTDM environment, in a base year toll model prepared using RTDM output like demand matrices, highway network, and relevant parameters. (page 3-5.)
By overestimating speeds and underestimating travel times, the model assigns more vehicles to I-5 than are actually observed. It seems clear that IBR prefers these higher forecasts because (a) they justify a larger project with more vehicle capacity, and (b) they create an inflated “no-build baseline” that systematically conceals or understates the travel-inducing environmental effects of the build alternative. The Kate model is dramatically less accurate than the Stantec model—it makes no sense to trust Kate’s results, embodied in the FEIS.
“Standard Industry Practice” is to exaggerate tolled traffic and revenue
Washington’s experience with inflated “investment grade” traffic and revenue estimates isn’t an anomaly: “Standard Industry Practice” is to exaggerate traffic and revenue. The problem of over-estimating traffic levels (and associated toll revenues) is endemic. Bond rating agency Fitch issued a scathing report on toll forecast errors. They warned that over-estimating revenue is common in the industry and is a key cause of financial problems for toll-financed projects. The Fitch message, summarized in the trade publication, Toll Roads News, is clear and stark:
They [Fitch] call demand forecasting “a key vulnerability,” adding: “The probability of over-estimation remains high despite decades of experience with forecasting demand on transport projects. Many greenfield projects over the years across many jurisdictions have suffered from this… While other risks have been manifested in many cases, defaults on debt have largely been driven by under-performance relative to original projections.”
Investment grade forecasts also routinely suffer from optimism bias. The consulting firms preparing these estimates have strong incentives to satisfy their clients interest to be able to justify the maximum amount of borrowing for their facilities, which leads them to over-estimate likely revenues. Around the county dozens of toll roads and bridges have failed to produce expected revenues, leading to delinquencies, defaults, and bankruptcies. As international expert Robert Bain‘s comprehensive review of industry practice found:
“The standard of some traffic and revenue studies, supporting infrastructure investments worth billions of dollars, is truly appalling,” Bain said. “Forecasts are commonly used to ‘sell’ deals to potential investors, insurers or rating agencies — so they are exposed to manipulation.”
In 2010, the Oregon State Treasurer hired Bain author of “Toll Road Traffic and Revenue Forecasts: An Interpreters Guide” to assist in the financial analysis of the Columbia River Crossing. He found numerous flaws and biase—which prompted calls for the investment grade analysis that produced dramatically different results than the highway department projects. Specifically, Bain reviewed the CRC traffic and revenue forecasts prepared for the project’s environmental impact statement on behalf of the Oregon State Treasurer. He found:
The traffic and revenue (T&R) reports fall short when compared with typical ‘investment grade’ traffic studies. As they stand they are not suitable for an audience focussed on detailed financial or credit analysis.
The traffic modelling activities described in the reports are confusing and much of the work now appears to be dated. Although a number of the technical approaches described appear to be reasonable, many of the modelling-related activities seem to ‘look backwards’; justifying model inputs and outputs produced some years ago.
No mention is made in the reports of historical traffic patterns in the area or volumes using the bridges. This is a strange omission. Traffic forecasts need to be placed in the context of what has happened in the past. If there is a disconnect (between the past and the future) – as appears to be the case here – a commentary should be provided which takes the reader from the past, through any transition period, to the future. No such commentary is provided in the material reviewed to date.
Traffic volumes using the I-5 Bridge have flattened-off over the last 15-20 years; well before the current recessionary period. . . . the flattening-off is a long-term traffic trend; not simply a manifestation of recent circumstances. The CAGR for the period 1999 – 2006 reduces to 0.6%
Over-predicting traffic is commonplace for toll road studies, even those done for “investment grade” forecasts. Streetsblog reported that:In 2012, the Reston (Virginia) Citizens Association completed a study [PDF] examining traffic projections provided by engineering firm Wilbur Smith (the company that did the very wrong IndianaToll Road projections, now called CDM Smith). The group collected data from 26 toll road projects on which Wilbur Smith had produced the traffic projections. During the first five years that were forecast, traffic projections overshot actual traffic every single year, and by an average of 109 percent, according to the report. In short, investment grade toll revenue forecasts are not as wildly unrealistic as the promotional forecasts produced by state highway agencies, but they still consistently over-estimate traffic volumes and toll revenues on newly tolled-roadways. They are decidedly not unrealistic worst-case scenarios as portrayed by IBR officials. As a practical matter, the results of the IGA’s confirm that overall traffic levels will be lower, and diversion to un-tolled parallel routes (in this case I-205) will be higher than acknowledged
Appendix: SR 520 Forecast

Also read:
- POLL: Did the Clark County Council make the right decision by rejecting the auditor authority proposal?
 The 3-2 council vote rejected giving the auditor’s office power to write financial impact statements for ballot measures.
 - Opinion: Hospital price transparency is good, but its impact will be limited
 Washington still shields hospitals from competition through certificate-of-need laws other states have repealed.
 - Vancouver amends municipal code, banning pedestrians from staying on traffic islands, medians
 Vancouver’s new ordinance targets people who remain on medians, not those crossing legally at crosswalks.
 - Opinion: Washington tax collections are running below forecast as the economy softens
 Washington’s tax collections are $135.4 million behind forecast since February as employment and revenue both slip.
 - Washington gas prices stay high despite Iran deal as automatic tax hike looms
 Washington’s gas tax rises 2% on July 1 under a new inflation-tied annual indexing mechanism.