

Regional transportation plans have light rail and bus rapid transit but no new vehicle capacity for metro region
The Interstate Bridge Replacement Project (IBRP) team says there is no third bridge in its regional transportation plans, and therefore they cannot consider a third bridge option.
Last week, Ray Mabey, IBRP assistant program administrator/ODOT state bridge engineer, said the following about the IBRP team considering a third bridge.
“The region’s long-term transportation plans do not currently include the creation of a new corridor across the Columbia River,’’ Mabey said. “While a discussion about a potential new crossing is certainly an important conversation that should be had, the current priority is addressing the existing need for improvements on the I-5 corridor to ensure that it keeps travelers and freight moving throughout the region safely for many years to come.”
What do the region’s transportation plans include? And, what don’t they?
In the Portland Metro Regional Transportation Plan (RTP), there is a map showing light rail coming into Clark county in downtown Vancouver. The Southwest Washington Regional Transportation Council (RTC) has a similar map in its plan plus two new bus rapid transit lines. Additionally, the Metro plan has language supporting light rail into Clark county on the I-205 corridor.
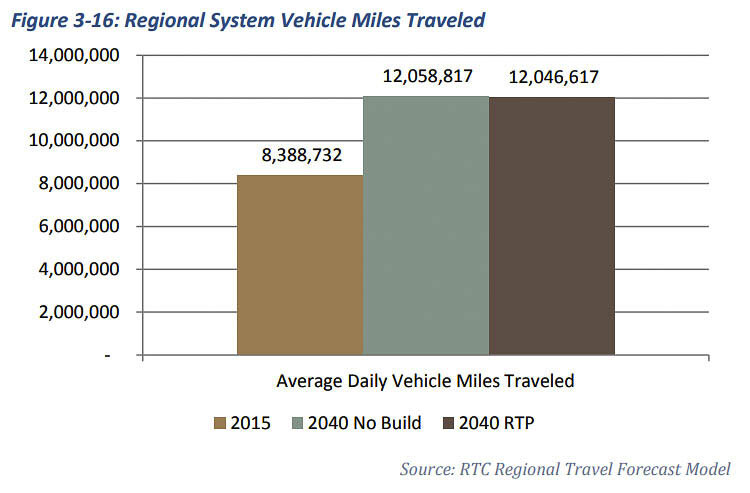
The RTC’s plan shows vehicle miles traveled (VMT) is expected to increase by over 43 percent from 2015 to 2040. The construction of the numerous projects in the plan will reduce VMT by one tenth of one percent, or just 12,200 vehicle miles, compared to the “no build” option.
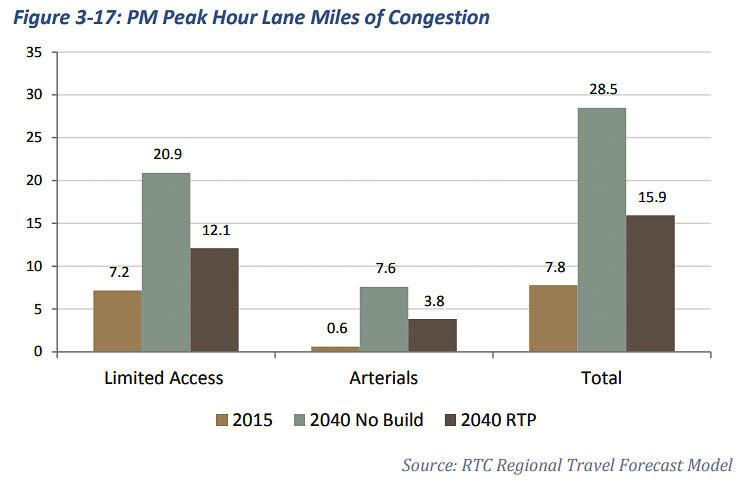
The evening “Peak Hour Lane Miles of Congestion” is projected to more than double by 2040 on highways and major arterials, even after implementing the plan.
The RTC represents three counties in Southwest Washington acting as the metropolitan planning organization, required for state and federal funding of projects. The 2019 RTP was adopted March 5, 2019 and has 2040 as its horizon year.
A month later, Clark County Councilor and RTC Board Member Gary Medvigy asked if the RTC could begin planning for third and fourth transportation corridors. RTC Director Matt Ransom responded by saying they are only allowed to plan for a 20-year time horizon, even though cItizens and RTC board members have been asking for third and fourth bridges for decades.
The first RTP for Clark County was adopted in December 1982, the month I-205 opened for travel across the Columbia River. Regional population has since doubled.
The RTC website says: “The RTP identifies the region’s existing and future travel demands and recommends policies, transportation strategies, and projects to meet the transportation needs. Transportation projects from state and local plans are included in the RTP.”
The RTC also has a Congestion Management Process. The most recent (2018) report says “Both Columbia River bridges are suffering daily congestion during morning and evening peak periods. The Interstate Bridge had reached capacity during peak hours in the early‐1990s, and the Glenn Jackson Bridge in the mid‐2000s “
The RTP contains a light rail extension into Vancouver and three Bus Rapid Transit lines, but no third or fourth bridge corridors across the Columbia River. But that is not because members of the RTC Board didn’t ask.
Medvigy asked the board to begin planning for a third bridge and fourth bridge at the April 2019 meeting. It was not his first time making the request. Earlier this year, he repeated his request for the RTC to begin planning for additional transportation corridors and new bridges across the Columbia River.
The RTP reports “The Glenn-Jackson Bridge that carries I-205 traffic across the Columbia opened in 1982. This provided a second Portland-Vancouver area river crossing. It relieved the bottleneck on I-5 and opened up access to the Portland region including access to Portland International Airport.”
It also states: “I-205 was constructed as an alternative route to I-5, as a by-pass facility through the Portland/Vancouver metropolitan area.” Citizens might wonder why additional bypasses aren’t proposed by transportation planners.
Between 1980 and 2010 the population of the county increased 253 percent from 192,227 in 1980 to 488,214 in 2019. Employment in Clark County increased by 322 percent from 52,870 jobs in 1980 to 170,200 in 2019.
For Clark County, the Office of Financial Management (OFM) projected 2040 population falls within a range from a low of 540,963 to a high of 762,479 with a mid-range projection of 643,551 according to the RTC.
In 2008, the RTC created a “Visioning Study.” It identified the transportation needs of Clark County when the population reached one million people. It indicated the need for two new bridges and transportation corridors, one west of I-5 and one east of I-205.
The high end of the 2040 population projection is three quarters of that population at 762,000 people. And yet, there is not even a single additional bridge in the RTP for 2040, let alone two.
Looked at another way, the Clark County population has grown from 192,000 in 1980 to 495,000 in 2020, a 257-percent increase since I-205 was constructed.
Projecting ahead to 2040, Clark County population will have increased by 451,000 people or 334 percent if one uses the RTP’s “midrange projection.” It would be a 397 percent increase at the high range. There will be at least a tripling of Clark County population and the RTC has no new transportation corridors planned.
The RTP reports vehicle miles traveled on an average weekday in Clark County in 2015 totaled about 8.3 million. By 2040, Vehicle Miles Traveled is forecasted to grow to over 12 million daily VMT; a 41-percent increase in vehicle miles traveled.
Citizens might wonder what it will take for regional transportation planners to actually begin planning for the third and fourth bridges they said we needed by the time we got to a million people?
The RTP data shows numbers of people commuting to work, from 1990 to 2016. The number of people commuting to work has almost doubled. How many drive alone? With 203,000 people commuting, 79 percent drive alone. That’s down just 1 percent in a quarter century from 1990. People prefer their cars as was demonstrated by the 2018 PEMCO study.
A recent IBRP citizen survey showed overwhelmingly that people say traffic congestion and reliable travel times are their number one priority.
The number of people who work from home increased from 3,590 to 13,197 in 2016, but remains a small 6.5 percent of workers. (That may change significantly in the post-COVID-19 world). People carpooling increased, but as a percentage of the total, it dropped two percentage points to 9 percent.
Mass transit use or “public transportation” accounted for a small 2.3 percent in 2016. It was at 2.6 percent in 2000.
The mean travel time to work increased from 21 minutes in 1990 to 26 minutes in 2016.
Oregon Metro Transportation Planning
Metro is the regional government for the Portland metropolitan area. They have an RTP most recently updated in 2018 for the 2040 time frame.
It expects to add 573,000 people and 345,000 jobs to the tri-county area by 2040. Expectations are for an additional 260,000 households and a total population of over 2.1 million people.
In transportation planning, Metro projects transit use will rise by 137 percent to 612,000 daily trips. That flies in the face of transit ridership on TriMet having peaked over a decade ago, and experiencing a gradual but consistent decline since 2009. Total boarding riders declined by nearly 10 million by 2019, and dropped significantly more due to the COVID-19 pandemic.
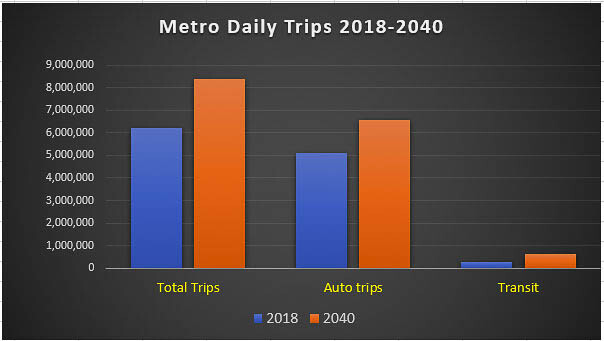
Overall, Metro projects there will be 8.3 million daily person trips in 2040 with 6.5 million of those by people in cars. That is 78 percent of people driving, and 7 percent of people using transit with an optimistic forecast for transit ridership. Walking trips will exceed transit trips each day.
Included in the Metro RTP is the statement: “Potential for extension of rapid bus service or light rail north from Gateway into Clark County,” along the I-205 corridor.
Back of napkin planning
Using those percentages as a guideline in a “what if” scenario — 2.3 percent of Clark County residents using transit, 6.5 percent working from home, and 9 percent carpooling — what will happen by 2040 when 86,000 new jobs are added?
Public transportation ridership will increase by 1,978 riders and carpooling will add 7,740 riders, according to the RTC. People working from home will increase by 5,590 people. The overwhelming majority (79 percent) or an additional 67,940 people will drive their own cars.
With the county presently having 155,000 jobs, how many of those work in Oregon? The Oregon treasurer reports 73,240 Clark County residents paid $236 million in Oregon income taxes in 2018. Roughly 47 percent of Clark County residents’ jobs are in Oregon.
If that 47 percent is the reality in 2040, then 31,900 additional people could be driving their own cars to work in Oregon, crossing the river. There could be another 35,900 new people commuting to work within Clark County in their private vehicles. They would be competing with the additional vehicles carrying 7,740 carpool users.
Peak lane usage on the Interstate Bridge is between 4,000 and 5,500 vehicles per hour on that already congested freeway. The Glenn Jackson Bridge can handle between 6,000 and 7,200 vehicles per hour because it has four lanes each direction instead of three lanes.
An average lane handles about 2,000 vehicles per hour at freeway speeds. You can see that due to congestion, the Interstate Bridge carries at least 1,000 fewer vehicles due to traffic congestion.The Glenn Jackson bridge handles 800 to 2,000 fewer vehicles at peak travel times.
If the average person is commuting in the morning, planners would need to provide 16 new lanes across the river if all those vehicles traveled in one hour. They would need eight new lanes if the travel is spread over a two-hour period, and five new lanes if they traveled over a three-hour period.
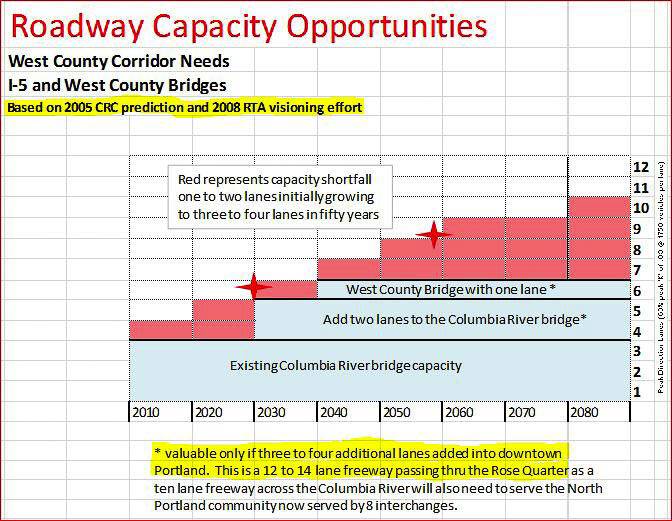
In the Columbia River Crossing (CRC) debate, transportation architect Kevin Peterson evaluated all the traffic projection numbers used for the project. His report showed that the western (I-5) transportation corridor would need five lanes in each direction by 2020 and eight lanes in each direction by 2050.
Peterson said that those lanes across the Columbia River would only work if one to two additional lanes were added in north Portland, due to all the additional traffic joining I-5 between Hayden Island and the Rose Quarter. He called the Rose Quarter “the elephant in the room.”
Presently, Oregon is wrestling with a proposed $795 million project at the Rose Quarter. The initial proposal was to extend auxiliary lanes and widen shoulders for safety, but would add no new through lanes on I-5. It would also add two “lids” creating real estate, over the top of Interstate 5.
The project is so controversial that the Albina Neighborhood Association and the city of Portland have withdrawn their support for the project.
One of the RTPs states: “Interstate freeways, classified as divided principal arterials, are designed to provide for the highest degree of mobility of large volumes of long-distance traffic. Collector facilities generally provide equal emphasis upon mobility and land use accessibility.”
Since no freeways and collector facilities have been added in the region, what will happen if the Rose Quarter isn’t widened with more through lanes? It’s been over four decades since a freeway or major transportation capacity has been added to the Portland metro area. Regional population has doubled and traffic congestion impacts regional traffic up to 12 hours a day.
It would appear for the moment that both transportation planning agencies acknowledge people will continue to use their private vehicles for the majority of their travel through 2040. What appears to be missing are the new roads and transportation corridors to handle the increased number of vehicles, let alone reduce the current levels of traffic congestion.