

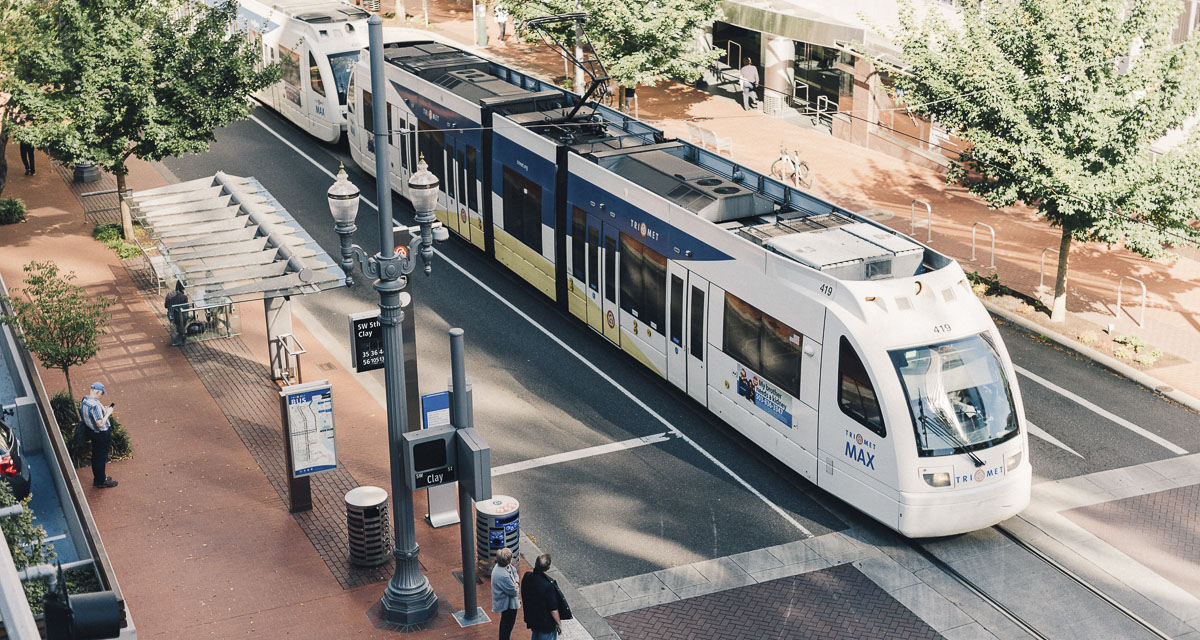
Randall O’Toole writes that ‘transit advocates talk endlessly about the advantages of transit over driving; Americans are paying for it but they aren’t using it’
Randall O’Toole|
The Antiplanner
Congress sporadically handed out transit capital funds in the 1970s and 1980s, but in 1991 it made it systematic with creation of the transit capital investment grants program, also known as New Starts. Since then, federal, state, and local taxpayers have spent more than half a trillion dollars on transit capital improvements. Transit agencies have also spent nearly $1.2 trillion on transit operations, only $355 billion of which was covered by passenger fares.
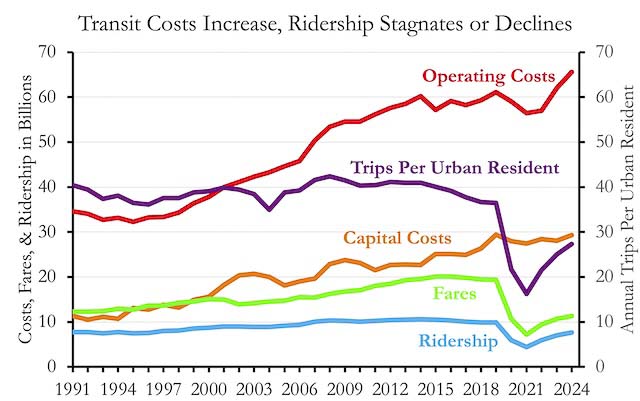
These numbers are from the National Transit Database Historic Time Series, the 2024 edition of which the Federal Transit Administration released last week along with the 2024 annual transit database that was featured here yesterday. While the above figures are in nominal dollars, after adjusting for inflation to 2024 dollars using GDP deflators, taxpayers have spent more than $1.8 trillion subsidizing transit since 1991.
What have we gotten for this excessively generous subsidy? In 1991, the average urban resident rode transit more than 40 times a year. Transit ridership grew between 1991 and 2014, but so did urban populations, so trips per resident increased to just 42. Ridership fell after 2014 and by 2019 the average urban resident took only 36 transit trips per year. As of 2024, it was around 27 trips per year.
This does not seem like a great return on a $1.8 trillion investment.
Transit has not relieved congestion. It hasn’t reduced greenhouse gas emissions. It hasn’t helped many low-income people, the vast majority of whom have their own cars and don’t use transit. All this $1.8 trillion has done is enrich a few special interest groups.
The historic time series consists of five different spreadsheets. The first two, tables TS1.1 and TS1.2, focus on how much transit funding comes federal, state, or local sources. More interesting is table TS2.1, which lists operating expenses, fares, route miles, revenue miles, revenue hours, riders, and passenger-miles, all broken down by both transit agencies and modes for each agency. Table TS2.2 is the same but broken down only by transit agencies, not by modes. Table TS3.1 has capital expenses broken down by agency and mode while table TS3.2 inventories assets by agency and mode. I mainly use 2.1 and 3.1.
Previous issues have included most data back to 1991, though capital costs began in 1992 and fares in 2002. For some reason, this year the FTA began many of the time series in 2015, so I turned to the 2023 time series to get earlier years.
The American Public Transportation Association’s Public Transit Fact Book includes capital costs and fares for the years that are missing from the historical time series. Though APTA’s data aren’t broken down by mode, they add to the continuous series of national data.
Transit advocates talk endlessly about the advantages of transit over driving. Americans are paying for it but they aren’t using it.
The Antiplanner is a forester and economist with more than fifty years of experience critiquing government land-use and transportation plans.
Also read:
- VIDEO: WA diesel hits record $6.53, crushing truckers and school budgets
 With diesel nearing $6.53 per gallon in Washington, trucking businesses and school districts now confront sharply higher fuel expenses affecting budgets and workers.
 - Opinion: In plain sight – yielding to pedestrians
 Drivers often fail to see pedestrians due to inattentional blindness, which highlights the need for more focused awareness at intersections and stronger safety practices.
 - Expect delays on SR 14 in Vancouver for guardrail repairs Wednesday
 State Route 14 travelers in Vancouver should plan for morning delays as WSDOT will close two eastbound lanes for guardrail repairs, affecting mileposts 6.0 to 7.0.
 - Overnight closure planned on westbound SR 14 Camas Slough Bridge Tuesday
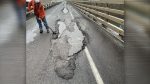 WSDOT crews will close westbound SR 14 at Exit 14 in Camas to collect bridge deck samples and plan future repairs; detours will be in effect.
 - Opinion: Stay in your lane – seriously, it’s the law
 Drivers must choose the nearest lane when turning in Washington, and left turns bring added risk. Even with signals, every driver must help prevent crashes by following law.