

Area resident and former County Councilor Dick Rylander attempts to help you better understand where your taxes are going and what the future impact of new taxes may be
Dick Rylander
for Clark County Today
When we see tax proposals come to the ballot those in support frequently refer to the “rate” rather than the total dollars to be collected. This “rate” is shown as an estimate of $$$ per $1000 of assessed value. Those writing the tax proposals usually show examples of the average or median home price and then do some math to show the impact.
For instance a tax may be $1/$1000. If the home value example used is say $400,000 then the actual amount of taxes would be $1 x 400 = $400. What is the median home value in Clark County. WA estimated to be currently? (Note: median means ½ of values are higher and ½ are lower). It appears that $550,000 is a reasonable estimate.
The higher the assessed value the higher the cost to the property owner. If, in this example, the assessed value was $1,000,000 then the tax owed would be $1 x 1000 = $1,000 or 2.25x more than the $400,000 example.
In today’s market what’s the distribution of assessed values as of 2024? Are there a lot of high value homes?
The Assessors Office did some research and were able to supply the following chart. Please accept that it is an estimate and a snapshot.
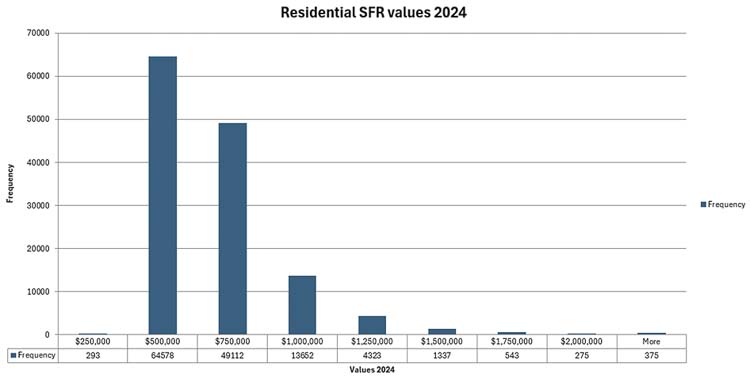
There are a total of 134,488 properties. Of those it appears that there are 20,505 of $1,000,00 or more which works out to about 15.2%.
What’s the value in knowing this distribution and knowing your own assessed value (and how the taxes are distributed) you can better understand where your taxes are going and what the future impact of new taxes may be.

Also read:
- Opinion: ‘A more responsible approach must be sought’
 Ken Vance argues a $10 billion funding gap makes the phased I-5 Bridge approach fiscally reckless, not responsible.
 - POLL: Do patriotic displays like Yacolt’s road striping help strengthen community spirit?
 A Yacolt road striping project tied to America’s 250th anniversary is dividing opinion in Clark County.
 - Opinion: The challenges of getting the Brockmann mental health facility open
 A $42 million, 48-bed mental health campus near WSU Vancouver was completed in 2025 but never opened due to lack of state funding.
 - Opinion: Washington’s business exodus accelerates due to high taxes, regulations driving companies away
 Washington’s business relocation rate has nearly tripled since winter 2025, per an AWB survey.
 - Letter: Food service, public health, and the Men’s Share House question
 Peter Bracchi asks why Share House’s 96,987 annual meals face less public-health scrutiny than a waterfront restaurant.