


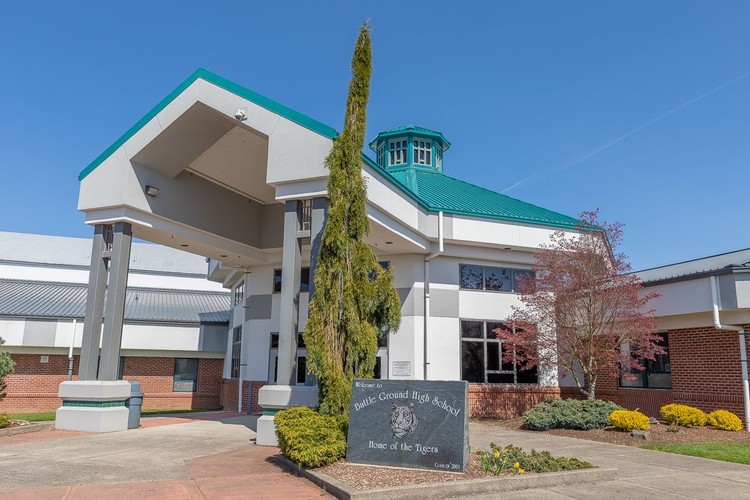
🎧 Battle Ground School Levy: What Does the November 2026 Levy Mean for Taxpayers?
Dick Rylander provides an analysis of the Battle Ground School District’s November 2026 EP&O Levy
Dick Rylander
for Clark County Today

Dick Rylander
This article is my analysis based on my research and interpretations. It contains a significant amount of detail and numbers. As such, if you need clarifications please reach out to someone whose opinion you trust and ask for their assistance.
On Thursday July 16, 2026 the BGSD Superintendent (Shelly Whitten) presented a levy proposal to the School Board Directors. The Board unanimously voted to approve placement of the levy on the November 2026 ballot.
A lot of discussion and information went into the decision on the part of the district leadership team and Board members. The Superintendent prepared four (4) levy options for the Board’s consideration. In the end, the Board chose Option #2. This represented their balancing their perception of the money they believe they need to meet the minimum district instructional needs (they would prefer more) and what the taxpayers would be able and willing to finance.
Contents of this article
The purpose of this article is to inform readers about the background and context of the levy proposal as part of the ongoing support of public schools and the amount of tax money collected. The sections of the article are:
- Local Levy amounts and changes over the past six years and the next three years.
- The impact of changes in the mandates for school districts by the Washington State Legislature.
- The impact of using this levy approval to take out loans to backfill the gap caused by the absence of operating levy money in 2026.
- Student population changes.
- Property tax factors in addition to the levy.
- Comparing School District Performance
- Available answers to common and expected questions about school operations.
- Battle Ground School District November 2026 Levy Amount
The levy money will go into the district’s General Fund to pay expenses of student safety, smaller classes, special education, reading and math support, curriculum, student activities, and preparing students for post secondary education, employment, or military, and educational programs and operations.
There were four (4) funding options shared with the Board of Directors.(est is 4.5% increase per year)
Instead of the previous 4 year levy this one will be 3 years. The amounts of money to be collected are proposed to be:
The “rate” is an estimate of the tax bill for each property owner that is calculated by distributing the approved total annual tax among all of the owners of taxable property in the County based on the fraction of the total assessed property value that each taxpayer owns. The increasing amount results from expectations that property values will increase and new construction will add to the total County property value (there is nothing stated regarding projected inflation rates in the levy.) To determine what the estimated impact is on your property taxes use this formula: Assessed value (AV) divided by 1000 x $1.76. Example: Assessed value $650,000 divide by 1000 = 650. Then take 650 x $1.76 = $1,144 per year or $95.33 per month. If your AV was $1,000,000 then 1,000 x $1.76 = $1,760/yr = $146.66/month.
The simplest way to compare the 3 year levy to the 4 year is to average the amount of money collected per year.
The last 4-year local operating levy approved by Battle Ground Public Schools voters was passed in November 2021. Total Amount: $115.7 million over 4 years (2022 thru 2025) which averaged $28,925,000 per year.
The first and second failed levies in 2025 both asked for $166,275,000 (average of $41,568,750 per year) over 4 years.
The 3rd failed levy in February 2026 asked for $189,510,000 (average of $47,377,500 per year)
Based on the proposed $116,830,000 for the new levy that works out to an average of $38,943,333 per year (Note: The year 1 collection would be $37,025,000.)
Using the average for the 2026 November levy we see $38,381,000 vs. the last approved levy of $28,925,000 (+132%). For 2026 November vs. the first two failed levy average of $41,658,750 (92%). The third failed levy average was at $47,377,500 (81%). Given the time frames it’s important to factor in inflation.
The inflation rate for the period of 2022-2025 was an estimated 18.8%. If we look at the last approved levy of $115.7 million x 18.8% a levy ask of $137,451,600 for the new levy ($34,362,000/year average) would cover inflation. So the proposed November levy at 38,813,000 average per year for 3 years) on a yearly equivalent provides a little extra money for some additional spending beyond inflation. The new proposed levy would be about $3.5 million MORE than inflation. One can argue that 3 additional years of inflation should be factored in (2027-2030). Current projections suggest a target of about 3-3.5% per year for that time frame.
- Underfunded or Unfunded Mandates –
The BGSD Superintendent says that there are $21.9M – $26.9M per year in program and service costs that State laws mandate, but are required to be paid for locally. She estimates that about $500,000 of that is 1 time with the remainder being annual recurring. Note: The district supplied a separate 4 page document with some details that is too large to include in this report. That could mean that if there are recurring mandated costs of $21mm/yr then the actual local funding for district choices would really be about $16 million ($37mm – $21mm) in 2027.
BGSD has a one year gap in levy funding to address this issue; the last operational levy had collections in 2025 and the proposed levy does not start until 2027. This has been addressed by a combination of laying off personnel who support enrichment programs that are not required by state law and spending the District reserves.
- Borrowing ahead of collections?
It is important to note that there is a clause in the levy document that appears to allow short term borrowing against future taxes at some cost. “Pending the receipt of those taxes, the District may issue short-term obligations pursuant to chapter 39.50 RCW or contract indebtedness pursuant to RCW 28A.530.080. Upon receipt, the District may use those taxes to repay such short-term obligations or indebtedness, all as may be authorized by law and determined necessary and advisable by the Board.”
At the board meeting it was mentioned that going to a 3 year levy would allow the district to come back to the public to show what they have used the money for and show the public that they (the leadership team) can be trusted. However…if all the money is going into the general fund how will the district show specific uses and outcomes? How will studious use of funds be shown? Will test scores improve? Will graduation rates be higher? How will they show value? What are the measurement metrics?
- Student population: Headcount vs. FTE
The number of students in the Battle Ground School District has been increasing steadily. If you examine the attendance at the same time each year, you will see that the attendance has increased by 578 (a 5% increase) over the last 6 years as measured in September. The most recent data (24/25 to 25/26) shows a loss of 405 students during the course of the school year. If that trend continues the district will continue to lose state funding and need to rely even more on local levies. The most recent 2 years may be more indicative of the current environment post Covid.
There is another way to look at the data and it’s called Full Time Equivalents (FTE). This uses partial students due to circumstances and situations. The district may only get say ½ a student because they are partially home schooled or attend a trade program or part-time college as some examples. Certain funding from the State uses FTE and other funding uses Headcount. In the end the numbers are similar.
If this link works it will take you to the BGSD website and open the PDF file that contains the data provided at the July 27, 2026 Board meeting: Microsoft PowerPoint – Enrollment Board 2025-26 MAY-JUN.pptx
- Property Tax Components
Every levy or tax request focuses on how much it will cost you for that specific “ask”. However, there are existing taxes and future potential taxes you may want to take into consideration to understand the total impact on your tax bill. For instance, voters approved a LARGE fire district increase which is now showing up. The State of WA raised taxes by an estimated $9 billion last year. Clark County Counselors approved a $366mm bond for jail renovations plus an increase in the operating levy to $1.15 per $1000 of assessed value (and increase of $0.45 per $1000). If those pass your taxes will go up. The BGSD Capital Levy expires in 2027. We have no idea if they will ask for the renewal or not. The State of WA has announced they are expecting a drop in revenue. Will that lead to even more taxes? We need to consider ALL tax requests and not each in isolation.
State school taxes
Every property owner pays taxes to the State for schools. Those have been labeled as State Schools Part 1 and Part 2. In our case those two account for $2,372 out of our total tax of $7,294. State schools account for about 32% of our total bill. On top of this add on any bonds or levies. For most people school taxes (local and state) consume 48-52% of all their taxes. Note: The BGSD levy expired and as a result the previous $1500, if still in place, would get us to the ~50% of total taxes range.
Spend per student per year
As of 2026 the average spend per student per year in Washington State is estimated to run between $18,000 and $20,000. Private schools charge about 67% of public school spend. Indeed, the spend per student has at least doubled in the past 10 years.
- Comparing School District Performance
Testing and Money
The test scores in WA K-12 started dropping in 2013. No one can explain why. Those declines have been well documented. So what (if any) correlation is there between spending more without corresponding improvement in test scores?
As spending has increased, test scores have not changed. Why isn’t money correlated with results?
Each of these tax requests may seem reasonable if you just consider them in isolation but the cumulative effect can have a significant effect on the amount of money that you have after paying your essential bills..
Information from the BGSD. This information comes from the district so you (the reader) can come to your own conclusion.
The national average of regulations in the employment and labor relations laws is 6,900. As of fall 2025 the average for Washington is 46,000!
2025-26 doesn’t end until August 31 and then takes a couple months to fully close. So using the last completed year is more accurate to compare “budgeted” numbers against the last five years as those are “actuals”.
Richland, Central Valley, and Bellingham are three of the districts we (BGSD) have used for comparison because they are similar in student enrollment and are a mix of urban and rural. They also have had similar wage/economic factors (more so in Richland and Bellingham than Central Valley). While not perfect they have been a decent metric. Here is some information about 24-25 from the OSPI audited F-196.
Below is a comparison using the 2024–25 audited F-196 data from OSPI. This shows not only how much districts spend, but also the resources available to them.
* Local levy revenue includes Educational Programs & Operations (EP&O) levy collections and other local general fund revenue reported through the F-196.
Using 2024-25 and 2018-19 may be best even though it is 6 years. COVID had strange impacts on budgets and without using “actuals” things just aren’t accurate when comparing
There appear to be mismatches between the F-196 financial and the OSPI report card. The F-196 appears to show headcount, while the report card uses FTE.
The tabular data from the OSPI report card for 2024-25 is:
Battle Ground Bellingham Central Valley Richland
Enrollment 13,080 11,388 15,102 14,499
$/Student $18,168 $19,838 $17,542 $16,661
>90% Attendance 71.5% 69.4% 73.7% 76.0%
Grad in 4yrs 80.6% 88.3% 94.2% 86.2%
Low Income 43.9% 41.7% 47.8% 43.7%
ELA %L3&L4 56.2% 62.8% 65.0% 60.7%
Math % L3&L4 25.4% 36.6% 34.8% 33.9%
Science % L3&L4 38.4% 38.3% 43.0% 19.2%
Oddly, the total dollars spent (calculated by multiplying the number of student times the spending per student) for the F-196 and the OSPI report cards are different by quite a bit: $20M for Bellingham and $6M for Battle Ground. I’m not quite sure what to make of that.
The testing performance data is for 10th grade for ELA and math and 11th grade for science. Battle Ground is at the low end of the distribution for ELA, seriously low in math, and Richland is seriously low in science. Within the year-to-year variability, it appears that Spokane schools are the best in class for this group.
Using the 6 years of 2019-20 and 2024-25 since both years are closed. We could go back one more year and have NO COVID discussion but in talking with others the budget was set and played out minimally since state funding wasn’t adjusted in March 2020 when schools went remote.
1) Average expenditure per student for the district in 24/25?
Response: $18,890 per student
2) How has the average spend per student changed in the past 6 years (2019-20)?
Response: $13,900 per student
3) How much money per student does the district receive from the State in 24/25 and how has that changed in the past 6 years (2019-2020)? 24/25 $15,080 19/20 $11,900
4) Is it an accurate assessment that the BGPS capital levy cost about 1000 of assessed value?
Response: It should be right in that range and shouldn’t change more than a .01-.02 from the previous year. The collection amounts by year are: 2025 $8.5 million; 2026 $9.2 million; 2027 $10.0 million and can only be used for the scope of work outlined in the capital levy (not transferred to general fund)
5) How many dollars in impact fees did the district receive in the most recently completed school year?
Response: 2024-25 $8,676,802.75 and can only be used for the scope of work outlined in the capital facility plan to address growth (not transferred to general fund)
There is information for every district across the state on the OSPI report card but it is lagging because they do not post until the budget year is closed out. This is also a difficult comparison because every dollar is “cooked” into the average cost per pupil. This leads to poor comparisons because districts vary widely in the needs and programs. For instance, Battle Ground by mileage is the 4th largest bussing district in the state the last time I checked. The amount per pupil for transportation is way higher than an urban district, like Vancouver who covers fewer miles. This is just one example and there are many. The state system tries to have money flow for these types of variances in programs but the uniqueness really makes per pupil average a less than ideal metric. One of the things we try to do to combat this is find similar districts.
Open Questions
1) What will inflation look like over the next 4 years (eroding the value of the levy dollars collected)? Should this be included in the “ask”?
2) What will the current teachers union negotiations yield in increased compensation changes? (Currently the district says 80-85% of the budget goes to personnel costs). Will the negotiations be different if the union believes the levy will pass vs. fails again?
3) Given all of the state and local tax increases are taxpayers in a position to give the district the levy money?
4) Since the money will go into the general operating fund, how will the public know specifically what it’s used for and assess the value?
5) How many programs, personnel and services does the district believe they need that are above and beyond the state funded? Are those really needed and how does the taxpayer know and trust the decisions?
6) How many people simply don’t believe they can afford any tax increase given their cost of living? How many people are getting 4.5% annual income increases just to break even?
7) What does the tax paying public want schools to do and does this levy satisfy those wants?
Summary/Conclusion
What if this 4th levy attempt fails? Answer: It may be time for McCleary 2.0. It may be time to resolve the un/underfunded mandates issues by getting the state to provide the funds. Wait…where will the State get the extra money? Answer: From taxpayers. They would need to raise State school property taxes so less local and more State…which does what? It reduces local choice and control.
As you have heard from the Battle Ground School Superintendent, most of the levy taxes will be used to support educational goals and procedures defined by the State Board of Education as part of their definition of a basic education. The growth of State educational mandate funding has eroded the amount of levy funds available for enrichments defined by the local needs.
In the end people will look at their personal finances and evaluate where best to spend their money. If they believe there is greater value for schools they will vote yes. If they believe their personal and household needs are greater, then they will vote no.
Finally, this link should take you to the BGSD 2026/27 budget planning report: https://go.boarddocs.com/wa/bgps/Board.nsf/pfiles/DWWMAK5A4FAF/$file/2026-27%20Budget%20Update%2008%2010%2026.docx.2-%20Google%20Docs.pdf
Ask questions. Contact the board members and Superintendent and share your thoughts, questions and opinions.
References
- Video recording of the meeting: Active Meetings – 11104 NE 149th Street, Brush Prairie, WA 98606 | PO Box 200, Battle Ground, WA 98604 | 360-885-5300 BoardDocs® Pro Choose Jly 16 and the click “Swagit” icon on the right.
- Levy proclamation/proposal on the district website
- Inflation and past levy information from web searches
- Articles from www.swweducation.org for Battle Ground

Also read:
- Opinion: ‘It may be time for McCleary 2.0’
 Dick Rylander examines the Battle Ground School District’s proposed $116,830,000 three-year EP&O levy heading to the November 2026 ballot.
 - Washington Policy Center tax expert warns that new income tax will affect everyone
 Ryan Frost argues Washington’s new 9.9% income tax has a $1M deduction that a simple legislative majority could remove.
 - Opinion: Were Republican voters just sleeping during the August primary election?
 CCRP Chairman Matt Bumala says 60% of primary no-shows in the 17th and 18th districts were Republicans.
 - Opinion: WA Cares’ launch showcased care WA Cares did not provide
 Gov. Ferguson showcased a caregiving arrangement at the WA Cares launch that the program had not paid for a single day of.
 - Auditor, auditor candidate address scrutiny over job title
 Greg Kimsey says roughly 40 county employees hold the deputy county auditor designation Kelly used in his campaign.