

Camas schools had 16.3 students per staff member at the end of the 2020 school year
Numbers and budgets are generally very unexciting. They are a challenge to understand when wading through spreadsheets and financial statements. Yet ferreting out numbers can be important to help voters understand how their tax dollars are being spent.
As our previous story reported, in the aftermath of the McCleary decision the Washington State Legislature has doubled its funding of K-12 education. The “per pupil” funding has risen from $6,775 in 2012 to an estimated $13,600 in 2020. Education spending is now over half the state’s general fund budget, despite the fact that the state “model is intended to provide ample funding.”
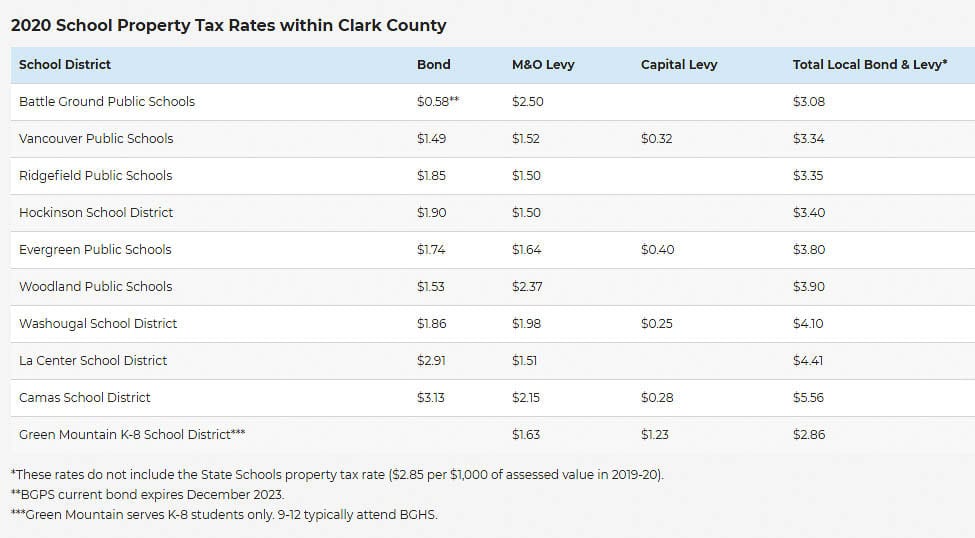
In 2020, Camas School District (CSD) property tax rates were the highest of any school district in Clark County. The lowest rate was $2.86 per thousand of assessed value in the Green Mountain District. Camas pays $5.56. The Evergreen district tax rate is $3.80 and Vancouver is $3.34. In Washougal, the tax rate is $4.10 and Battle Ground it is $3.08. These rates do not include a state school tax rate of $2.85.
In the debate over the CSD levies, some observers are claiming teachers are underpaid. Camas has 181 elementary school homeroom teachers in 2020. The average salary (not including benefits) was $86,174. The median salary for those same teachers was $90,100.
Camas has 196 secondary teachers. The average salary in 2020 was $89,350 and the median salary was $96,900. The fact that the median is higher than the average shows the CSD has a lot of “senior,” more experienced teachers at both the secondary and elementary levels.
Camas teachers are among the highest compensated in the state. This state website takes a look at salaries of individual school district employees. Retirement and benefits add 30-40 percent more to calculate total compensation.
The data shows 197 CSD employees make $100,000 or more. Another 168 employees make $80,000 to $99,999; and 125 employees make $60,000 to $79,999. Over one third of CSD employees on the payroll (365 of 981) are making a salary of $80,000 or more.
The school district provided handouts indicate that 55 percent of the Educational Programs and Operations (EP&O) levy, which is one of two levies the CSD has on the Feb. 9 special election ballot, will pay for “additional positions (pay and benefits).” The current CSD Executive Summary shares today’s reality:
“Over five years, salary and benefit costs have increased 51 percent with a 14 percent increase in full-time employee equivalents (FTE). The expenditure increase has aligned with revenue increases in the past and were largely driven by increases in salary and benefit cost, which represent about 88 percent of total district costs. Current expenditure growth trends outpaces projected state revenue growth. Future realignment of expenditures to better match the revenue curve will be necessary for a sustainable model moving forward.”
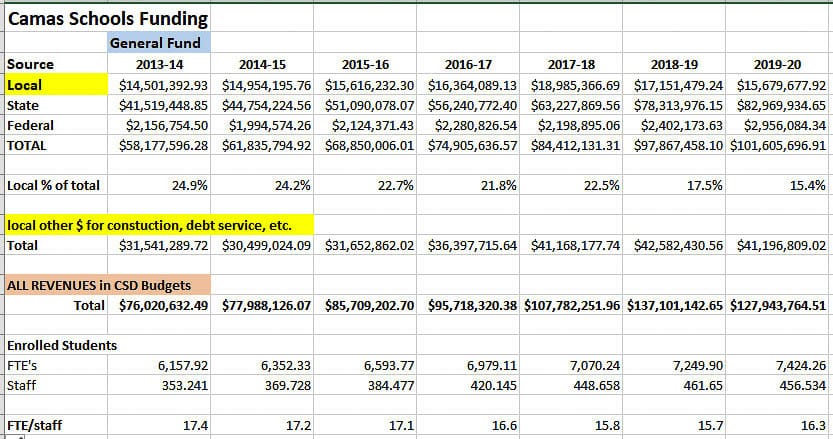
Some voters might think schools are understaffed and so they may feel the need to pay for lower class sizes to improve the quality of the children’s education. Since McCleary, the student population increased 20.5 percent, from 6,157 to 7,424 students in 2020. Whereas staff increased 29.2 percent from 353 to 456. CSD currently has around 7,000 students.
In 2020, the data shows there were 392 elementary and secondary school teachers, plus an additional 12 “other” and substitute teachers on the CSD payroll. There were 7,424 students for a ratio of 16.3 students for each teacher. The legislature funds all-day kindergarten and no more than 17 students per certificated staff in grades K-3.
Total CSD staffing, teachers and administrators, were 456 in 2020 according to the school apportionment report. In the 2013-14 school year, there were 353 total staff handling 6,158 students. Looked at another way, there were 17.4 students per staff member in 2013-14 versus 16.3 students per staff member at the end of the 2020 school year.
Camas has 172 aides, 19 counselors, eight psychologists, nine speech-language pathologists on staff. There are 64 staff designated as “Other,” 54 listed as “Professional,” 47 were “Office/Clerical,” and 55 as “Technical” according to the state salary report.
Total people on the 2020 payroll were 981 according to the Office of the Superintendent of Public Instruction (OSPI) data. Voters may ask what the difference is between the 981 people listed in the OSPI payroll data and the school apportionment reports filed stating 456 FTE staff.
One communication indicated the legislature funds “1.175 staff for nurses for the entire school district.” CSD currently employs 9.57 nurses and health assistants.
The CSD states “fundamentally, the General Fund budgeting environment is driven by flattening revenues driven by the state funding formula, and annual expenditure increases of approximately 9% annually over the past 4 years, driven by growth in personnel costs.”
CSD shares “state funding is guided by a state funding model. The model is intended to provide ample funding for education in order to comply with education as the state’s ‘paramount duty’ per the WA State Constitution.”
But then, the district refers to declining state revenues, via the “regionalization factor.”
Flattening state revenues: State funding must increase annually to keep up with cost of living increases. The state funding model, however, is structured in a way which will decrease revenue growth for Camas in out-years. The state model uses a “regionalization” factor to account for higher cost of living areas such as Camas. Camas’ regionalization factor was set at 12% for 2019-20. That means that our state revenue was increased by 12% over the funding model baseline calculations. Camas is one of 31 districts, however, where the regionalization factor decreases annually. Starting in 2020-21, regionalization decreases 1% annually for Camas, which works against other increases in the model.
Voters can think of the legislature giving the CSD and 30 other districts a “bonus” in their funding model. (There are 294 school districts in the state.) They told these districts they would get the “bonus” for two years, and then the bonus would decline by 1 percent per year. All districts in the state would be treated equally in just over a decade if the legislature doesn’t change the funding model.
Camas received a 12 percent “bonus” for two years and district officials were aware it would decline by 1 percent each year, which means board members knew about the decline when they agreed to amend employee contracts in 2018.
Here is one CSD graphic showing the decline.
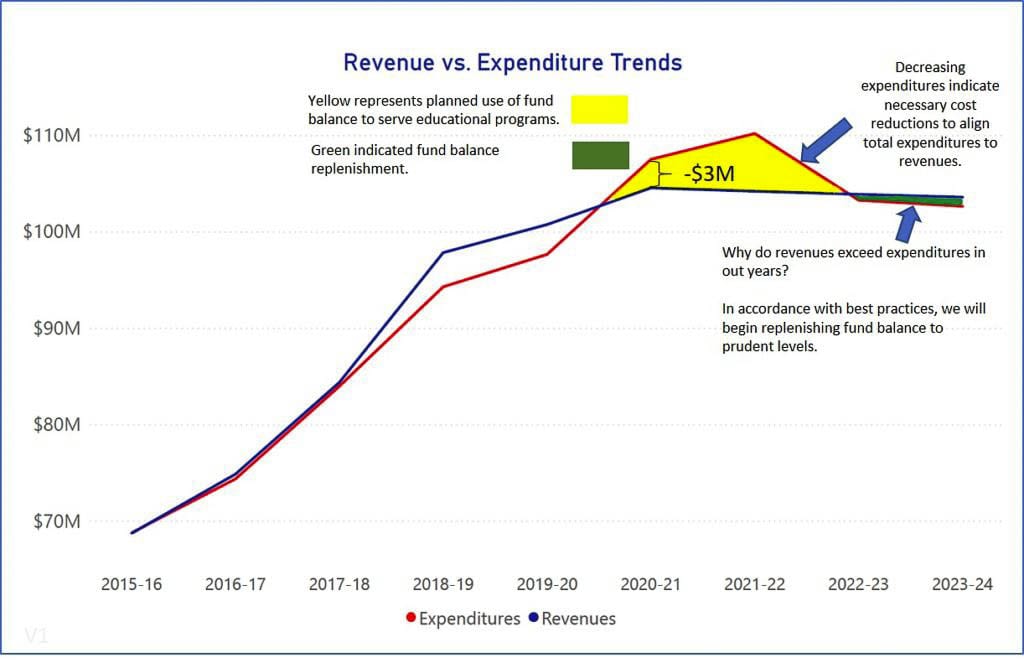
The district attempted to share why they have the funding problem. There were “annual expenditure increases of approximately 9% annually over the past 4 years, driven by growth in personnel costs.”
CSD also shared the following. “Over five years, salary and benefit costs have increased 51 percent with a 14 percent increase in full-time employee equivalents (FTE). The expenditure increase has aligned with revenue increases in the past and were largely driven by increases in salary and benefit cost, which represent about 88 percent of total district costs.”
The state Supreme Court ruled in 2012 that the legislature was not living up to their duty to provide adequate funding for K-12 education, and there was an unfair burden on local property taxpayers. In the 2013-14 school year, Camas residents paid $46,042,682 in local school taxes. In the 2019-20 school year, residents paid 23 percent more or $56,876,486. State funding has doubled during that time.
One final note. The tax rates mentioned in CSD literature are an estimated assessment “per thousand of assessed value” on property. That assessed value changes each year.
The Camas population was estimated to be 19,998 in 2013 and 25,630 in 2020, a 28 percent increase. The median-priced Camas home according to Zillow was estimated to be $295,000 in Jan. 2013, and $493,000 seven years later in Jan 2020 or a 67 percent increase.
Most of the data in this article came from reviewing many documents on the OSPI website. The F-196 report for the CSD was the primary source of information. The Apportionment report contained student and staffing numbers. The salary website is here.
If the two levies on the Feb. 9 special election ballot are rejected, the CSD would have the option to put another vote on the ballot in April. The district needs a simple majority for each levy to pass.