

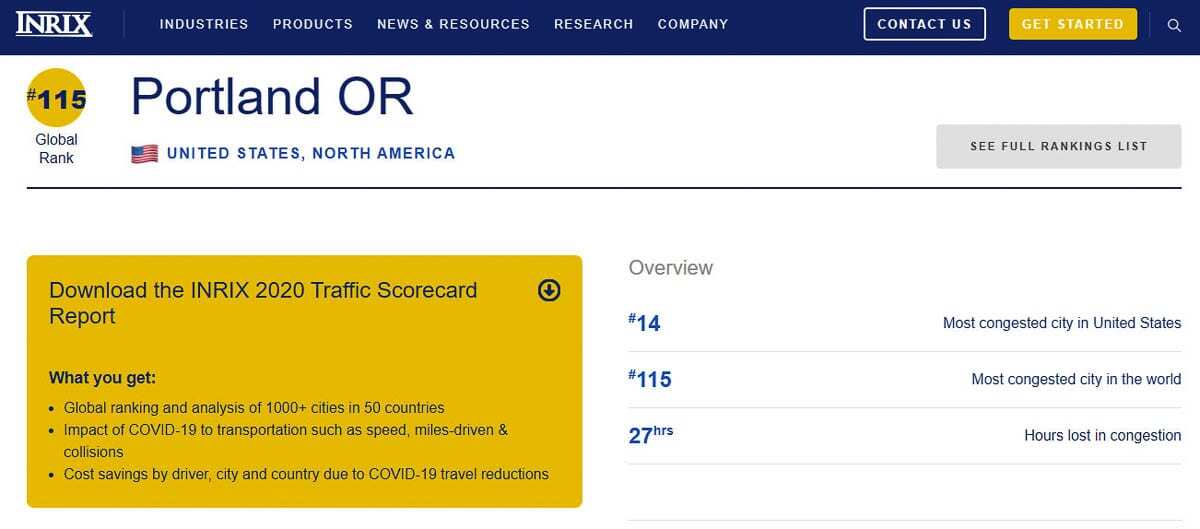
Traffic to downtown Portland drops 66 percent
The Kirkland-based firm INRIX has released their 2020 survey of global traffic congestion. The Portland metro area ranks 14th worst in the nation and 115th worst in the world. People lost 27 hours being stuck in traffic in 2020, but average speeds in morning and afternoon traffic increased from 21 mph to 30 mph due to the reduced number of vehicles on the road.
INRIX reported COVID-19 has had a large impact in several transportation-related areas, accelerating certain trends, curtailing others, and creating new challenges. For example, working from home had outpaced transit two years ago as a commute mode nationwide, yet the pandemic forced many employers to close offices and allow even more remote workers.
Portland ranked the 8th worst in 2017, the 10th worst in 2018, and 8th worst in 2019, where people lost 89 hours being stuck in traffic. Last year that dropped to 27 hours, so people gained 62 hours due to reduced vehicles on the road.
These numbers are reflected in metro area residents citing they want a reduction in traffic congestion. Multiple transportation surveys indicate traffic congestion and reliable travel times are the top priority for citizens on both sides of the Columbia River. Read “The People Speak” story here.
A January 2019 Metro poll showed the number one priority was roads and highways. They reported 31 percent of citizens want “widening roads and highways” as their top priority. The Portland Tribune summarized: “On its own, improving public transit is a lower priority than making road improvements and the more overarching goal of easing traffic — voters still overwhelmingly rely on driving alone to get around,” reads the poll’s conclusions.
The year-over-year trips in Portland dropped 66 percent, one of the steeper declines in the nation. The decline in Los Angeles was 34 percent; New York City 48 percent, and Houston 54 percent. Work-from-home policies, restaurant, entertainment, fitness and other brick-and-mortar closures, along with limits on gatherings, had an outsized effect in the densest parts of each region according to INRIX. There was no mention of the impact last summer’s downtown Portland violence had on traffic reduction.
Trips to downtown Portland declined 77 percent in April, 69 percent in September, and 65 percent in December. The February 2021 year-over-year decline was 66 percent.
As traffic volume dropped due to the global pandemic, vehicle speeds increased, which has played a significant role in the rise of fatality rates around the world. The number of collisions dropped by 28 percent, but fatality rates increased.
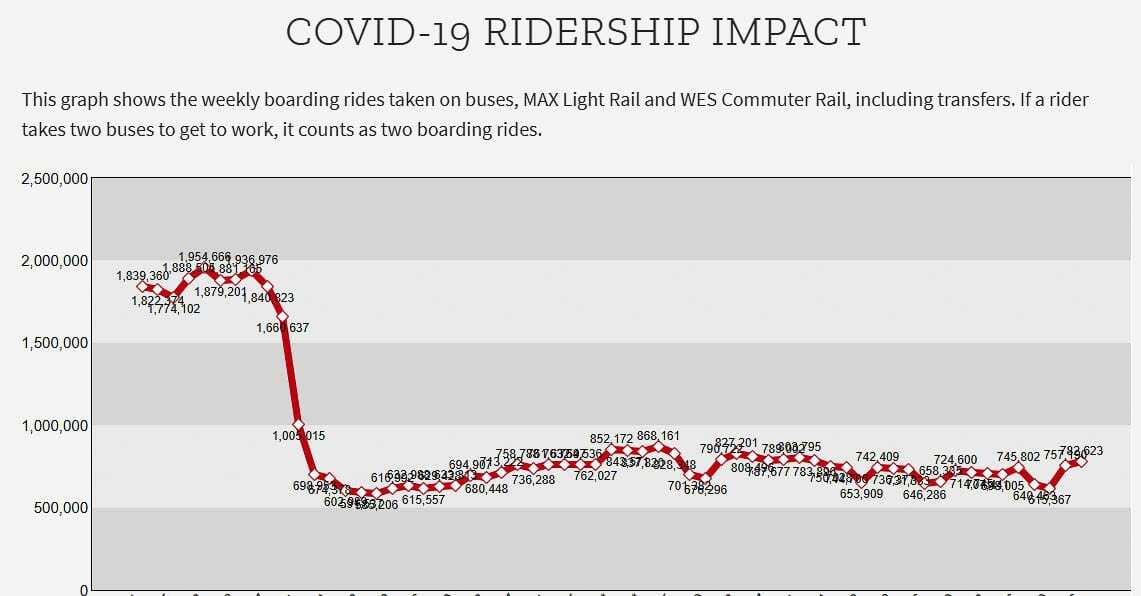
Transit ridership has plummeted as well according to INRIX. “In the U.S., while automobile travel rebounded in many metro areas, transit ridership declined in nearly every major metro, including New York (-55 percent), Los Angeles (-43 percent) and Chicago (-57 percent). International cities, like London, saw tube ridership drop more than 65 percent, and bus ridership drop more than 40 percent, even in October and November, seven months into COVID-19.”
Locally, C-TRAN’s commuter ridership (express buses) declined 58.2 percent due to COVID-19 in the initial months of the pandemic. TriMet experienced a roughly 60 percent decline in their systems ridership. Amtrak’s Cascades line ridership plummeted 68 percent in 2020 according to ODOT.
A separate “Riskiest Roads” report by INRIX shared the following in the aftermath of COVID-19 impact on collisions. “The recent spikes in fatality rates in Q2, and in collisions in Q3, further add to a volatile time in transportation. Between April and July, fatality rates skyrocketed to levels last seen in 2006, while crash rates decreased. Yet in the following three months, vehicle miles traveled (VMT) growth was surpassed by collisions, reversing the early “trend” seen at the onset of the pandemic.”
Speed of travel within one mile of the downtown Portland core increased from 14 mph in 2018 and 2019 to 18 mph. Separately, they show average speeds increased by 41 percent from April to July and collisions dropped by 50 percent. Vehicle miles traveled dropped by 31 percent.
In the Portland area, I-5, I-84 and US 26 were identified as the riskiest corridors.
Congestion at the most basic level can be described as the demand for road space exceeding supply. For example, highways designed to operate safely at speeds of 60 mph can move nearly 2,300 cars per lane per hour at 45 mph. However, that same roadway may carry fewer than 700 cars per lane during facility breakdown, according to INRIX.
“Given the differing impacts of COVID-19-related government shutdowns and restrictions on travel and trade, traffic congestion levels are now reflective of factors outside of population and employment density, road capacity and mode shares INRIX reported.
In general, and in a “normal” year, the most congested cities in the world are either older or rapidly growing cities according to INRIX. High-density development patterns characteristic of pre-automobile cities, as found in the most congested European and North American cities, like Paris and New York, makes them particularly ill suited to the movement of vehicles. In contrast to these older cities, South American cities, like Bogota and Quito, are combating extreme population growth, in geographically constrained environments, with underdeveloped infrastructure. This trendline is reflected in low last mile speeds, despite increases during the COVID-19 pandemic.
The 2020 Scorecard calculates time loss by analyzing peak speed and free flow speed data for the busiest commuting corridors and sub areas as identified by data density. Employing free-flow data enables a direct comparison between peak periods and serves as the basis for calculating time loss. Total time lost is the difference in travel times experienced during the peak periods compared to free flow conditions on a per-driver basis. In other words, it is the difference between driving during commute hours versus driving at night with little traffic.