

Once the pandemic hit, transit operational costs increased while passengers abandoned public transportation for various reasons
Elyse Apel, Tom Gantert and Brett Rowland
The Center Square
In 2019, transit agencies across the U.S. for all modes of transportation took in 32.3 cents in fares for every dollar they spent on operating costs.
Those transit agencies recovered 18.4 cents in fares on the dollar in 2020 and just 12.8 cents in 2021.
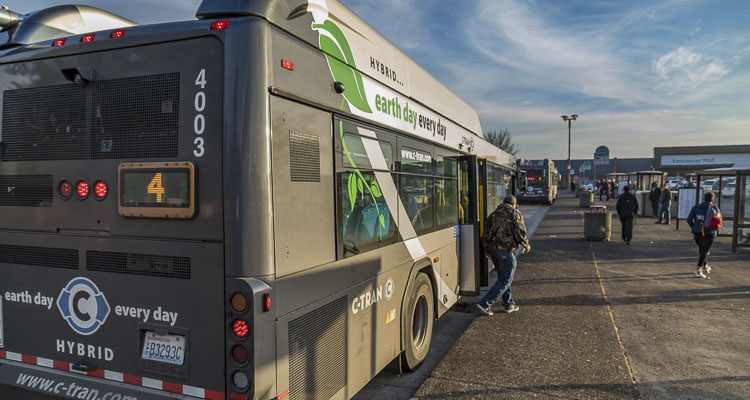
Once the pandemic hit, transit operational costs increased while passengers abandoned public transportation for various reasons – including fear of COVID-19, working from home and having some transportation shut down.
That loss in farebox revenue was made up by an injection of federal taxpayer dollars. The federal government gave transit agencies $71.7 billion in four relief packages in response to the COVID-19 pandemic, according to a report from rating agency S&P.
The National Transit Authority stated 852 transit agencies across the U.S. spent $13.1 billion in federal pandemic relief funds mostly on operational expenses in 2021, a 95 percent increase from the previous year.
All forms of transit saw the percentage of farebox revenue compared to operating expenses drop in 2021. For example, farebox revenue was 49.1 percent of operating expenses in 2019, the year before the pandemic hit. In 2021, the farebox revenue dropped to 19 percent.
Recently released data from the Federal Transit Administration sheds light on how the COVID-19 pandemic continued to cripple public transportation throughout 2021 and how federal taxpayer funding kept it running.
Federal funding was the predominant source of funding for transit, something the report says was due to the “COVID-19 public health emergency.”
From 2021 to 2020, federal funding for transit operating expenses rose dramatically. In 2020, federal funding made up 25.8 percent of the funding, while in 2021 that percentage rose to 36.2 percent.
In 2019, federal funding made up only 7.1 percent of funding for operating expenses.
In Southwest Washington, C-TRAN’s percent of operating revenue to operating costs were as follows:
2021
- Fixed Route: 5.9 percent
- Demand Response: 1.7 percent
- Vanpool: 37.7 percent
2020
- Fixed Route: 7.3 percent
- Demand Response: 2.2 percent
- Vanpool: 28.3 percent
2019
- Fixed Route: 14.2 percent
- Demand Response: 3.5 percent
- Vanpool: 35.3 percent
This story was first published by The Center Square.
Also read:
- Opinion: In search of joy at Vancouver Mall during Christmas time
 Paul Valencia reflects on his annual Christmas-time visit to Vancouver Mall, finding nostalgia, people-watching, and moments of joy amid last-minute holiday shopping.
 - VIDEO: WA and OR lawmakers irked as update on I-5 Bridge costs still missing
 Washington and Oregon lawmakers expressed frustration after planners failed to provide updated cost estimates for the I-5 Bridge replacement during a recent legislative oversight meeting.
 - Opinion: Atmospheric River events mean even less clearance for vessels crossing under the proposed Interstate Bridge Plan
 Neighbors for a Better Crossing argues that high river levels from atmospheric river events further reduce vessel clearance under the proposed Interstate Bridge design, creating long-term navigation risks on the Columbia River.
 - Vancouver USA Arts & Music Festival opens applications for 2026 performers, artists, and more
 Organizers of the Vancouver USA Arts & Music Festival have opened applications for 2026 performers, artists, and vendors ahead of the three-day event returning to downtown Vancouver in August.
 - Opinion: Why I won’t mourn the end of enhanced ACA subsidies
 Elizabeth New (Hovde) argues that allowing enhanced ACA subsidies to expire forces a necessary conversation about rising health care costs rather than continued cost shifting to taxpayers.
 - Columbia River salmon and steelhead endorsement goes into effect Jan. 1
 Beginning Jan. 1, anglers 15 and older must purchase a Columbia River salmon and steelhead endorsement to fish for those species in the Columbia River and many Washington tributaries.
 - City of Washougal launches Strategic Plan Dashboard and shares year-end update
 The city of Washougal has launched a new Strategic Plan Dashboard and released a year-end update outlining progress, economic indicators, and key accomplishments tied to its 2023–2028 Strategic Plan.