


Once the pandemic hit, transit operational costs increased while passengers abandoned public transportation for various reasons
Elyse Apel, Tom Gantert and Brett Rowland
The Center Square
In 2019, transit agencies across the U.S. for all modes of transportation took in 32.3 cents in fares for every dollar they spent on operating costs.
Those transit agencies recovered 18.4 cents in fares on the dollar in 2020 and just 12.8 cents in 2021.
Once the pandemic hit, transit operational costs increased while passengers abandoned public transportation for various reasons – including fear of COVID-19, working from home and having some transportation shut down.
That loss in farebox revenue was made up by an injection of federal taxpayer dollars. The federal government gave transit agencies $71.7 billion in four relief packages in response to the COVID-19 pandemic, according to a report from rating agency S&P.
The National Transit Authority stated 852 transit agencies across the U.S. spent $13.1 billion in federal pandemic relief funds mostly on operational expenses in 2021, a 95 percent increase from the previous year.
All forms of transit saw the percentage of farebox revenue compared to operating expenses drop in 2021. For example, farebox revenue was 49.1 percent of operating expenses in 2019, the year before the pandemic hit. In 2021, the farebox revenue dropped to 19 percent.
Recently released data from the Federal Transit Administration sheds light on how the COVID-19 pandemic continued to cripple public transportation throughout 2021 and how federal taxpayer funding kept it running.
Federal funding was the predominant source of funding for transit, something the report says was due to the “COVID-19 public health emergency.”
From 2021 to 2020, federal funding for transit operating expenses rose dramatically. In 2020, federal funding made up 25.8 percent of the funding, while in 2021 that percentage rose to 36.2 percent.
In 2019, federal funding made up only 7.1 percent of funding for operating expenses.
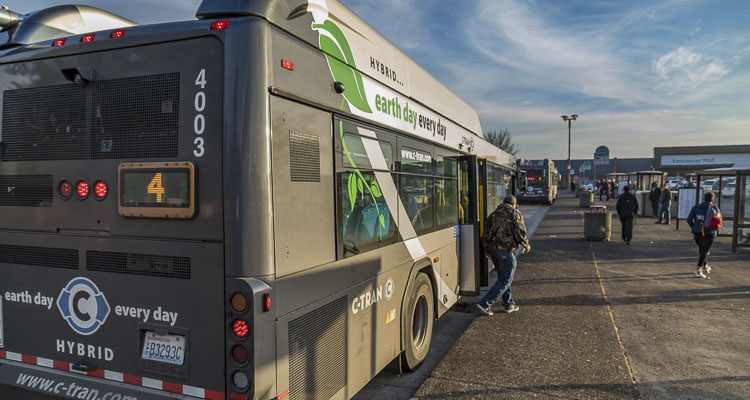
In Southwest Washington, C-TRAN’s percent of operating revenue to operating costs were as follows:
2021
- Fixed Route: 5.9 percent
- Demand Response: 1.7 percent
- Vanpool: 37.7 percent
2020
- Fixed Route: 7.3 percent
- Demand Response: 2.2 percent
- Vanpool: 28.3 percent
2019
- Fixed Route: 14.2 percent
- Demand Response: 3.5 percent
- Vanpool: 35.3 percent
This story was first published by The Center Square.
Also read:
- Opinion: Were Republican voters just sleeping during the August primary election?
 CCRP Chairman Matt Bumala says 60% of primary no-shows in the 17th and 18th districts were Republicans.
 - High school football: New coach prepares for long-term success at Prairie High School
 James Young-Lewis, a Clark County native who graduated from Evergreen in 2009, became Prairie’s head coach in May after working as an assistant coach across various programs since 2015, joining Prairie’s staff in 2024.
 - Cost to battle 20 wildfires in WA has topped $200M
 Twenty wildfires have cost Washington $207M in one month, more than two-thirds of what DNR spent all last fiscal year.
 - Opinion: WA Cares’ launch showcased care WA Cares did not provide
 Gov. Ferguson showcased a caregiving arrangement at the WA Cares launch that the program had not paid for a single day of.
 - Former State Rep. Liz Pike provides update on husband Neil Cahoon
 Neil Cahoon, a Camas resident, has undergone multiple surgeries including five on Aug. 15 after the Aug. 10 crash near La Center’s Daybreak Airport.
 - Opinion: Portland’s War on Cars Part 4 – A smarter automobile strategy to end gridlock
 O’Toole argues fuel wasted in Portland-area congestion has sextupled since 1982, generating 250,000 tons of extra greenhouse gases annually.
 - $1,000 first prize for Camas Plein Air Art Event honoring Marquita Call on Sept. 26
 Plein air artists compete Sept. 26 in Camas for $1,000 first prize honoring gallery founder Marquita Call.
 wpDiscuz