


Clark County resident Dick Rylander offers his insights on the Battle Ground School District levy on the Feb. 10 special election ballot
Dick Rylander
for Clark County Today
 See Grok’s analysis of this story
It’s a matter of money, results and fear. The 2027-2030 total proposed EP&O Levy would be $189,510,000. The previous four-year levy was $115,700,000. The difference between the expiring and proposed = $73,810,000 which is an increase of 63.79 percent.

The inflation rate for the 2022-2025 time frame was 15.8 percent. The previous four-year levy was $115,700,000 x 1.158 percent (inflation rate) = $133,980,000 to stay even. The new proposed levy of $189,510,000 minus expiring four-year adjusted for inflation is $133,980,000 which is an increase of $55,530,000 above inflation.
The levy that failed two times last year would have generated $166,275,000. The new proposed levy, at $189,510,000, is $23,235,500 higher. So waiting a year increased the “ask” by $23 million. That appears to be close to the amount that was projected to be cut before the district got an extra $6 million from the state.
Teacher contract negotiations start in 2026. If this levy passes it’s reasonable to assume, based on past history, that a significant portion of this Operations Levy will go to personnel costs. When we look at student headcount for 2024/25 we went from 12,162 in September down to 12,038 in June for a LOSS of 124 students. Test scores show 25 percent are failing English Language; 31 percent are failing Math and 25 percent are failing Science. Only 81.2 percent graduate.
In the last 10 years the amount of money being spent per student is near or exceeding $20,000 per student per year. For that amount of money what do we see when we look at testing results? Here’s a link to the OSPI district data: https://reportcard.ospi.k12.wa.us/ReportCard/ViewSchoolOrDistrict/100018
What do we see?
First, they changed the way they report the data to try and make it look better. Student performance of Level 2 was below expectations. Now, they combined 2 with 3 and 4 in an effort to make the numbers look better. Let’s look at the scores for 4th and 8th grade (you can choose English Language or Math).
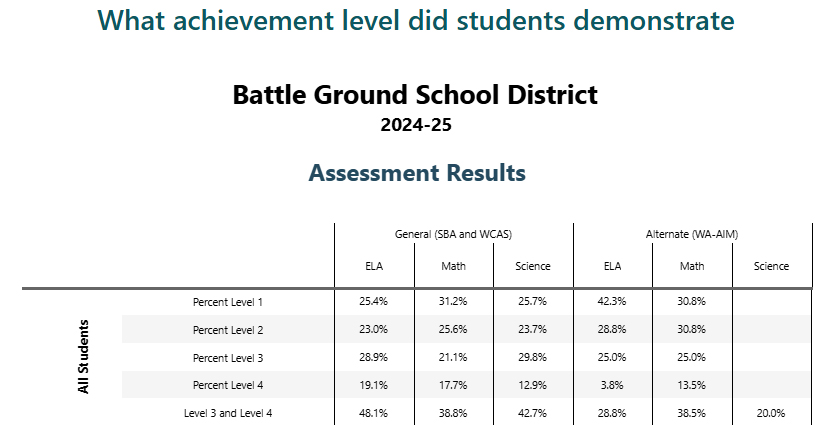
What does the data say? English 48.4 percent are failing. Math 56.8 percent are failing. Science 61.6 percent are failing.
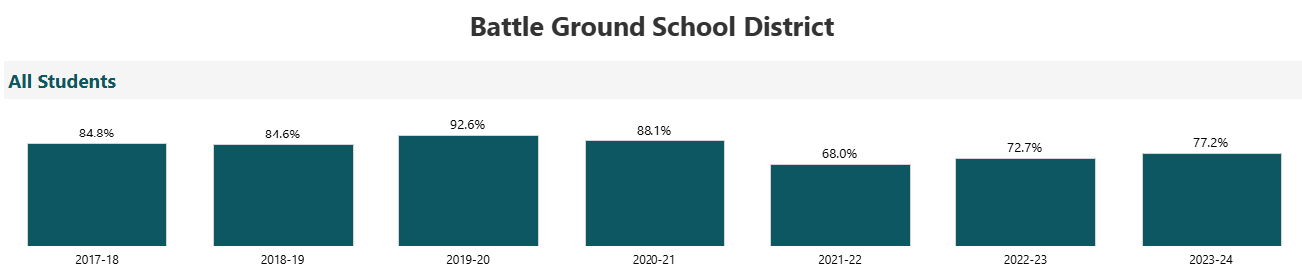
Attendance is down significantly in the past seven years. Why aren’t students attending class?
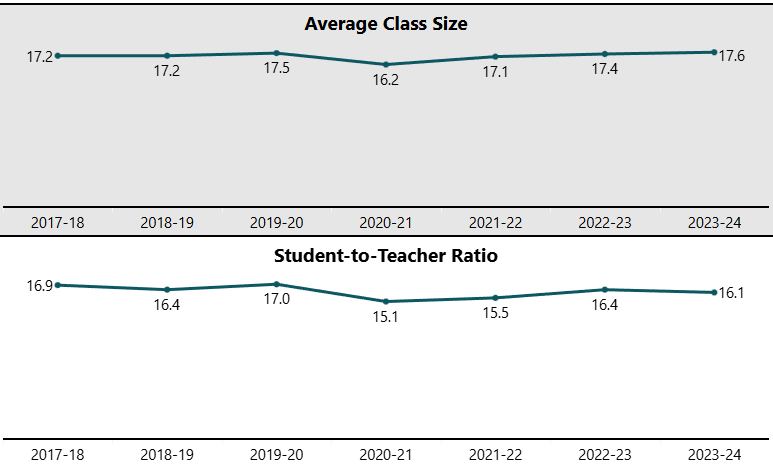
What does the chart above say? Class sizes are small and the ratio is near optimum. So, why are the test results so poor?
Where does most of the money go? Over 80 percent of the entire budget goes to personnel. How much do teachers and principals and admin and other positions make? The best data we have access to is only through 2023-2024 (so it’s 2–3 years old). Take a look for yourself and look up specific people: https://fiscal.wa.gov/K12/K12Salaries
We love high quality people and think they should be well compensated. However, like all jobs, people get burned out but the unions protect their members. There is no competition. It’s a state run monopoly. Less than 20 cents of every dollar goes to facilities, utilities and other upkeep and services. It’s worth noting that the median income for individuals in the Battle Ground School District is less than teachers make. Nearly two-thirds of households in the district have no students in the school system.
Do you want your money spent on DEI? Male athletes in female sports? Pronouns? Or would you prefer a focus on core education?
Data: https://schooldataproject.com/battle%20ground%20school%20district
Summary
The state increased taxes last year by about $9 billion … and are going into session as this article is published to apparently ask for more. Do you have more to give? Washington state is now one of the most expensive in the nation.
The estimated cost per school district for the February 2026 Special Election is below:
- Battle Ground School District – approximate allocated cost is between $210,000-230,000.
- Hockinson School District – approximate allocated cost is between $25,000-35,000.
- Washougal School District – approximate allocated cost is between $60,000-70,000.
We all love our children. The state takes so much in taxes already why not have the state pay the bill so there are no local levies at all? The only way to make that happen is to vote no and force the state’s hand. Yes it’s painful in the short term but necessary. More details at www.swweducation.org

This independent analysis was created with Grok, an AI model from xAI. It is not written or edited by ClarkCountyToday.com and is provided to help readers evaluate the article’s sourcing and context.
Quick summary
In this opinion column, Clark County resident Dick Rylander urges a “no” vote on Battle Ground School District’s Feb. 10, 2026 four‑year Educational Programs & Operations levy request of $189,510,000. He argues the proposal represents a 63.79% increase over the expiring levy—far above inflation—and ties his opposition to declining enrollment, weak test scores, and high per‑student spending.
What Grok notices
- Compares the proposed levy total with the prior levy and inflation, using that gap as a central argument for why the increase is unjustified.
- Links to OSPI‑hosted report‑card data so readers can check enrollment trends and performance measures referenced in the column.
- Discusses election timing and reports estimated election costs (about $210,000–$230,000 for Battle Ground), arguing that special‑election dynamics can shape turnout and outcomes.
- Points readers to a “School Data Project” site (as referenced) for a fuller set of district indicators, and notes that compensation or salary updates may be relevant context for levy requests.
- Reflects the author’s framing that voters should prioritize core classroom outcomes and scrutinize whether additional local taxes are producing measurable results.
Questions worth asking
- If approved, how would levy dollars be targeted to improve specific areas such as math and science proficiency, and what benchmarks would be used to measure progress?
- With declining enrollment, how are staffing levels, facility capacity, and long‑term capital needs expected to change over the next four years?
- What state‑level funding reforms have been proposed that could reduce district reliance on local levies for routine operations?
- How does Battle Ground’s per‑student spending and academic performance compare with similarly sized districts in Washington, using the same reporting sources?
- What accountability measures—clear spending categories, annual reporting, independent audits, or outcome metrics—would ensure levy revenue is directed toward classroom instruction and stated priorities?
Research this topic more
- OSPI Washington School Report Card – district performance, demographics, and trend data
- Washington State Legislature – RCW statutes governing school levies and local funding
- Fiscal.WA.gov – K‑12 salary, staffing, and expenditure data
- Battle Ground Public Schools – levy information, budgets, and explanatory materials
- Washington State School Directors’ Association – levy election guidance and resources

Also read:
- State Representatives McClintock and Ley answer questions at town hall in Battle Ground
 Residents voiced rising concerns about property taxes, school funding debates, the impact of new income tax legislation, and major costs tied to the Interstate Bridge plan.
 - As Washington gets an income tax, the fight to overturn it begins
 Opponents are organizing lawsuits and potential ballot measures to challenge the new 9.9% income tax on Washington households earning over $1 million.
 - VIDEO: WA diesel hits record $6.53, crushing truckers and school budgets
 With diesel nearing $6.53 per gallon in Washington, trucking businesses and school districts now confront sharply higher fuel expenses affecting budgets and workers.
 - WA’s status solidifies as one of the most expensive places in US
 A new study shows Washington outpaces most states on cost of living, with metrics revealing a sharp rise in daily expenses and major metro areas ranking among the nation’s most expensive.
 - Opinion: Someone explain the Democrat Party to me please
 Lars Larson criticizes Democrat politicians for shutdown threats, Homeland Security funding refusals, and positions on election laws, housing, and gun rights.